1. Introduction
Electricity access remains one of the central constraints on rural development in Nigeria. Many rural communities are either completely off-grid or weakly connected to distribution networks that experience frequent outages, low voltage, and limited-service hours. These conditions are consistent with wider evidence that electricity access and reliable supply are closely linked with income growth, welfare, education, health-service delivery, and structural transformation in developing economies
| [1] | T. Zhang, X. Shi, D. Zhang, and J. Xiao, "Socio-economic development and electricity access in developing economies: A long-run model averaging approach," Energy Policy, 2019, 132, 223–231. https://doi.org/10.1016/j.enpol.2019.05.031 |
| [2] | W. B. I. I. U. WHO., "Tracking SDG 7: The Energy Progress Report 2024," Washington, D. C, 2024. [Online]. Available:
http://documents.worldbank.org/curated/en/099031225175211404 |
[1, 2]
. In Nigeria and other sub-Saharan African countries, unreliable electricity also increases dependence on diesel and petrol self-generation, which raises household and enterprise energy costs and exposes communities to fuel-price volatility
| [3] | T. O. Araoye, E. C. Ashigwuike, M. J. Mbunwe, O. I. Bakinson, and T. I. Ozue, "Techno-economic modeling and optimal sizing of autonomous hybrid microgrid renewable energy system for rural electrification sustainability using HOMER and grasshopper optimization algorithm," Renewable Energy, 2024, 229, 120712–120712. https://doi.org/10.1016/j.renene.2024.120712 |
| [4] | IEA, "Africa energy outlook 2022," in International Energy Agency, ed, 2022. |
[3, 4]
. The consequences of unreliable rural electricity extend beyond inconvenience. Power interruptions affect health posts, schools, borehole pumping, food preservation, agro-processing, mobile communication, and security lighting. Productive-use loads such as milling, refrigeration, irrigation, and charging services are particularly important because they link electrification directly to local income generation and enterprise viability
| [5] | N. Kumar, K. Namrata, and A. Samadhiya, "Techno socio-economic analysis and stratified assessment of hybrid renewable energy systems for electrification of rural community," Sustainable Energy Technologies and Assessments, 2023, 55, 102950–102950. https://doi.org/10.1016/j.seta.2022.102950 |
| [6] | H. Akter, H. O. R. Howlader, F. Mamud, A. Y. Saber, A. Yona, and T. Senjyu, "Optimal sizing and performance analysis of hybrid microgrid for remote island of developing country: Effect of sustainable parameters, benefits and installation barriers," Franklin Open, 2024, 6, 100074–100074.
https://doi.org/10.1016/j.fraope.2024.100074 |
[5, 6]
. For this reason, rural electrification should be treated not only as an energy-sector intervention but also as a public-safety, economic-stability, and human-development strategy
| [1] | T. Zhang, X. Shi, D. Zhang, and J. Xiao, "Socio-economic development and electricity access in developing economies: A long-run model averaging approach," Energy Policy, 2019, 132, 223–231. https://doi.org/10.1016/j.enpol.2019.05.031 |
| [7] | J. J. Bouendeu, F. A. Talla Konchou, M. N. B. Astrid, M. F. Elmorshedy, and T. René, "A systematic techno-enviro-socio-economic design optimization and power quality of hybrid renewable microgrids," Renewable Energy, 2023, 218, 119297–119297. https://doi.org/10.1016/j.renene.2023.119297 |
[1, 7]
.
Hybrid renewable microgrids have become an increasingly attractive option for rural electrification. By combining photovoltaic generation, wind generation, biomass, diesel backup, battery storage, and, in some cases, hydrogen storage, microgrids can provide electricity to isolated communities without waiting for full national-grid extension
| [8] | A. Razmjoo, R. Shirmohammadi, A. Davarpanah, F. Pourfayaz, and A. Aslani, "Stand-alone hybrid energy systems for remote area power generation," Energy Reports, 2019, 5, 231–241.
https://doi.org/10.1016/j.egyr.2019.01.010 |
| [9] | S. Vendoti, M. Muralidhar, and R. Kiranmayi, "Techno-economic analysis of off-grid solar/wind/biogas/biomass/fuel cell/battery system for electrification in a cluster of villages by HOMER software," Environment, Development and Sustainability, 2021, 23(1), 351–372.
https://doi.org/10.1007/s10668-019-00583-2 |
[8, 9]
. The rapid decline in solar photovoltaics (PV) and battery costs has strengthened the case for decentralized energy systems, particularly in countries with strong solar potential such as Nigeria
| [3] | T. O. Araoye, E. C. Ashigwuike, M. J. Mbunwe, O. I. Bakinson, and T. I. Ozue, "Techno-economic modeling and optimal sizing of autonomous hybrid microgrid renewable energy system for rural electrification sustainability using HOMER and grasshopper optimization algorithm," Renewable Energy, 2024, 229, 120712–120712. https://doi.org/10.1016/j.renene.2024.120712 |
| [4] | IEA, "Africa energy outlook 2022," in International Energy Agency, ed, 2022. |
[3, 4]
.
However, much of the hybrid microgrid literature remains dominated by cost-based optimization. Studies commonly minimize net present cost (NPC), or levelized cost of energy (LCOE), while reliability is handled as a constraint, often through loss of power supply probability (LPSP)
| [9] | S. Vendoti, M. Muralidhar, and R. Kiranmayi, "Techno-economic analysis of off-grid solar/wind/biogas/biomass/fuel cell/battery system for electrification in a cluster of villages by HOMER software," Environment, Development and Sustainability, 2021, 23(1), 351–372.
https://doi.org/10.1007/s10668-019-00583-2 |
| [10] | W. Khalid, Q. Awais, M. Jamil, and A. A. Khan, "Dynamic Simulation and Optimization of Off-Grid Hybrid Power Systems for Sustainable Rural Development," Electronics, 2024, 13(13), 2487–2487.
https://doi.org/10.3390/electronics13132487 |
| [11] | M. Bilal, P. N. Bokoro, and G. Sharma, "Hybrid optimization for sustainable design and sizing of standalone microgrids integrating renewable energy, diesel generators, and battery storage with environmental considerations," Results in Engineering, 2025, 25, 103764–103764.
https://doi.org/10.1016/j.rineng.2024.103764 |
[9-11]
. This approach can hide important planning risks. A design that appears cost-optimal under stable diesel prices may become unaffordable when fuel prices rise. Similarly, a design with low average LCOE may fail to protect critical community loads such as clinic refrigeration, water pumping, and security lighting during renewable-resource or demand shocks
| [12] | T. K. Roy, M. A. Mahmud, and A. M. T. Oo, "Techno-economic feasibility of stand-alone hybrid energy systems for a remote Australian community: Optimization and sensitivity analysis," Renewable Energy, 241, 122286–122286.
https://doi.org/10.1016/j.renene.2024.122286 |
| [13] | M. Salehi, M. Khanali, and H. Ghasemi-Mobtaker, "Techno-economic analysis of renewable hybrid system microgrids for minimizing grid power outages in residential areas," Cleaner Engineering and Technology, 2025, 25, 100924–100924.
https://doi.org/10.1016/j.clet.2025.100924 |
[12, 13]
.
For rural Nigeria, this limitation is significant. Diesel prices are volatile, foreign-exchange exposure affects imported equipment and fuel, and demand can grow rapidly once productive-use activities emerge
| [3] | T. O. Araoye, E. C. Ashigwuike, M. J. Mbunwe, O. I. Bakinson, and T. I. Ozue, "Techno-economic modeling and optimal sizing of autonomous hybrid microgrid renewable energy system for rural electrification sustainability using HOMER and grasshopper optimization algorithm," Renewable Energy, 2024, 229, 120712–120712. https://doi.org/10.1016/j.renene.2024.120712 |
[3]
. A rural microgrid design should therefore be judged not only by its base-case cost but also by its ability to preserve supply security and economic affordability under uncertainty. This paper responds to that challenge by proposing a structured rural security–economic stability (RSES) framework for hybrid renewable microgrid design.
The paper makes three contributions. First, it introduces a composite RSES decision index that combines supply security, economic stability, and socio-environmental performance into a single normalized score. Composite indices and multi-criteria methods are increasingly used in energy planning because they allow planners to evaluate cost, reliability, emissions, and social priorities simultaneously rather than sequentially
| [5] | N. Kumar, K. Namrata, and A. Samadhiya, "Techno socio-economic analysis and stratified assessment of hybrid renewable energy systems for electrification of rural community," Sustainable Energy Technologies and Assessments, 2023, 55, 102950–102950. https://doi.org/10.1016/j.seta.2022.102950 |
| [7] | J. J. Bouendeu, F. A. Talla Konchou, M. N. B. Astrid, M. F. Elmorshedy, and T. René, "A systematic techno-enviro-socio-economic design optimization and power quality of hybrid renewable microgrids," Renewable Energy, 2023, 218, 119297–119297. https://doi.org/10.1016/j.renene.2023.119297 |
[5, 7]
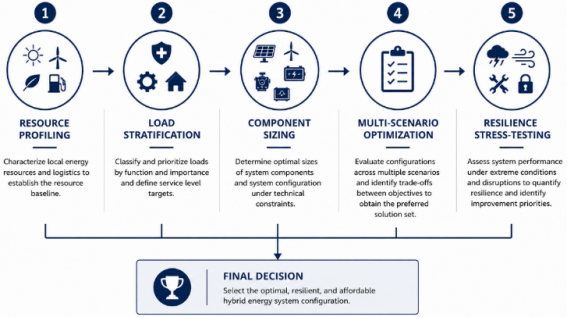
. Second, the paper presents a five-stage workflow for rural microgrid design: resource profiling, load stratification, component sizing, multi-scenario optimization, and resilience stress-testing. Third, it applies the framework to a representative Northern Nigerian rural cluster and compares four candidate architectures: PV/Wind/Battery, PV/Diesel/Battery, PV/Wind/Hydrogen, and PV/Biomass/Battery.
The paper addresses three research questions (RQ):
RQ1: How can reliability, affordability, and socio-environmental performance be jointly formalized in a rural hybrid microgrid design framework?
RQ2: Which of the four selected architectures performs best under a representative Northern Nigerian rural load?
RQ3: How sensitive are the security and economic-stability outcomes to diesel-price, solar-resource, and demand-growth shocks?
The rest of the paper is organized as follows. Section 2 reviews the relevant literature. Section 3 presents the RSES framework and decision index. Section 4 describes the case-study assumptions and modelling method. Section 5 presents the results, including architecture ranking, energy balance, biomass reconciliation, tier-level reliability, RSES traceability, shock sensitivity, and weight sensitivity. Section 6 discusses policy and implementation implications. Section 7 presents limitations and future work. Section 8 concludes the paper.
2. Literature Review
2.1. Hybrid Renewable Microgrids for Rural Electrification
Hybrid renewable microgrids have been widely studied for rural and remote electrification because they can combine local renewable resources, dispatchable backup, and storage to improve supply continuity in weak-grid or off-grid communities
| [8] | A. Razmjoo, R. Shirmohammadi, A. Davarpanah, F. Pourfayaz, and A. Aslani, "Stand-alone hybrid energy systems for remote area power generation," Energy Reports, 2019, 5, 231–241.
https://doi.org/10.1016/j.egyr.2019.01.010 |
| [9] | S. Vendoti, M. Muralidhar, and R. Kiranmayi, "Techno-economic analysis of off-grid solar/wind/biogas/biomass/fuel cell/battery system for electrification in a cluster of villages by HOMER software," Environment, Development and Sustainability, 2021, 23(1), 351–372.
https://doi.org/10.1007/s10668-019-00583-2 |
[8, 9]
. Common configurations include PV/Wind/Battery, PV/Diesel/Battery, PV/Biomass/Battery, PV/Wind/Diesel/Battery, and PV/Wind/Hydrogen systems. PV/wind/diesel/battery systems have been modelled for rural Nigeria by Araoye, et al.
| [3] | T. O. Araoye, E. C. Ashigwuike, M. J. Mbunwe, O. I. Bakinson, and T. I. Ozue, "Techno-economic modeling and optimal sizing of autonomous hybrid microgrid renewable energy system for rural electrification sustainability using HOMER and grasshopper optimization algorithm," Renewable Energy, 2024, 229, 120712–120712. https://doi.org/10.1016/j.renene.2024.120712 |
[3]
, while Vendoti, et al.
| [9] | S. Vendoti, M. Muralidhar, and R. Kiranmayi, "Techno-economic analysis of off-grid solar/wind/biogas/biomass/fuel cell/battery system for electrification in a cluster of villages by HOMER software," Environment, Development and Sustainability, 2021, 23(1), 351–372.
https://doi.org/10.1007/s10668-019-00583-2 |
[9]
examined solar/wind/biogas/biomass/fuel-cell systems for Indian village clusters. Kumar, et al.
| [5] | N. Kumar, K. Namrata, and A. Samadhiya, "Techno socio-economic analysis and stratified assessment of hybrid renewable energy systems for electrification of rural community," Sustainable Energy Technologies and Assessments, 2023, 55, 102950–102950. https://doi.org/10.1016/j.seta.2022.102950 |
[5]
evaluated hybrid renewable systems for rural communities in India using techno-socio-economic criteria, demonstrating that rural microgrid planning benefits from combining technical and socio-economic indicators.
Studies from other developing and remote contexts also show the importance of location-specific resource and demand modelling. In Bangladesh, Das and Kundu
| [14] | T. K. Das and D. Kundu, "Feasibility and sensitivity analysis of a self-sustainable hybrid system: A case study of a mountainous region in Bangladesh," Energy Conversion and Management: X, 2023. 20, 100411–100411.
https://doi.org/10.1016/j.ecmx.2023.100411 |
[14]
analyzed hybrid system feasibility for mountainous communities, while Ali, et al.
| [15] | M. F. Ali, M. R. I. Sheikh, R. Akter, K. M. N. Islam, and A. H. M. I. Ferdous, "Grid-connected hybrid microgrids with PV/wind/battery: Sustainable energy solutions for rural education in Bangladesh," Results in Engineering, 2025, 25, 103774–103774. https://doi.org/10.1016/j.rineng.2024.103774 |
[15]
examined PV/wind/battery microgrids for rural education facilities. Akter, et al.
| [6] | H. Akter, H. O. R. Howlader, F. Mamud, A. Y. Saber, A. Yona, and T. Senjyu, "Optimal sizing and performance analysis of hybrid microgrid for remote island of developing country: Effect of sustainable parameters, benefits and installation barriers," Franklin Open, 2024, 6, 100074–100074.
https://doi.org/10.1016/j.fraope.2024.100074 |
[6]
studied remote-island hybrid microgrids and highlighted both performance benefits and installation barriers. In Afghanistan, Tayyab, et al.
| [16] | Q. Tayyab, N. A. Qani, M. H. Elkholy, S. Ahmed, A. Yona, and T. Senjyu, "Techno-economic configuration of an optimized resident microgrid: A case study for Afghanistan," Renewable Energy, 2024, 224, 120097–120097.
https://doi.org/10.1016/j.renene.2024.120097 |
[16]
optimized a residential microgrid configuration, while Amal and Ibrahim Ismael
| [17] | T. M. Amal and H. Ibrahim Ismael, "Design and Simulation of a Hybrid Wind/Solar/Diesel/ Battery Off-Grid System for Rural Areas: A case Study in Al-Mahmudiyah Tribal Zone of Iraq," ZANCO JOURNAL OF PURE AND APPLIED SCIENCES, 2023, 35(2). https://doi.org/10.21271/ZJPAS.35.2.2 |
[17]
studied a wind/solar/diesel/battery system for rural Iraq. These studies collectively show that architecture performance is strongly dependent on local resource endowment, fuel logistics, component costs, and load profile.
Solar PV is often the dominant renewable source because of its modularity, declining cost, and strong compatibility with daytime rural loads
| [3] | T. O. Araoye, E. C. Ashigwuike, M. J. Mbunwe, O. I. Bakinson, and T. I. Ozue, "Techno-economic modeling and optimal sizing of autonomous hybrid microgrid renewable energy system for rural electrification sustainability using HOMER and grasshopper optimization algorithm," Renewable Energy, 2024, 229, 120712–120712. https://doi.org/10.1016/j.renene.2024.120712 |
| [4] | IEA, "Africa energy outlook 2022," in International Energy Agency, ed, 2022. |
[3, 4]
. Wind can improve supply diversity where wind speeds are sufficient, although low or moderate wind regimes often reduce its economic value
| [12] | T. K. Roy, M. A. Mahmud, and A. M. T. Oo, "Techno-economic feasibility of stand-alone hybrid energy systems for a remote Australian community: Optimization and sensitivity analysis," Renewable Energy, 241, 122286–122286.
https://doi.org/10.1016/j.renene.2024.122286 |
| [14] | T. K. Das and D. Kundu, "Feasibility and sensitivity analysis of a self-sustainable hybrid system: A case study of a mountainous region in Bangladesh," Energy Conversion and Management: X, 2023. 20, 100411–100411.
https://doi.org/10.1016/j.ecmx.2023.100411 |
[12, 14]
. Diesel generators remain common because of dispatchability, but their exposure to fuel-price volatility and emissions creates long-term risk
| [10] | W. Khalid, Q. Awais, M. Jamil, and A. A. Khan, "Dynamic Simulation and Optimization of Off-Grid Hybrid Power Systems for Sustainable Rural Development," Electronics, 2024, 13(13), 2487–2487.
https://doi.org/10.3390/electronics13132487 |
| [11] | M. Bilal, P. N. Bokoro, and G. Sharma, "Hybrid optimization for sustainable design and sizing of standalone microgrids integrating renewable energy, diesel generators, and battery storage with environmental considerations," Results in Engineering, 2025, 25, 103764–103764.
https://doi.org/10.1016/j.rineng.2024.103764 |
[10, 11]
. Biomass systems are attractive in agricultural regions because they can provide dispatchable renewable generation, but they depend on reliable feedstock supply, moisture control, collection logistics, and sustainable residue extraction
| [7] | J. J. Bouendeu, F. A. Talla Konchou, M. N. B. Astrid, M. F. Elmorshedy, and T. René, "A systematic techno-enviro-socio-economic design optimization and power quality of hybrid renewable microgrids," Renewable Energy, 2023, 218, 119297–119297. https://doi.org/10.1016/j.renene.2023.119297 |
| [9] | S. Vendoti, M. Muralidhar, and R. Kiranmayi, "Techno-economic analysis of off-grid solar/wind/biogas/biomass/fuel cell/battery system for electrification in a cluster of villages by HOMER software," Environment, Development and Sustainability, 2021, 23(1), 351–372.
https://doi.org/10.1007/s10668-019-00583-2 |
[7, 9]
. Hydrogen storage can provide long-duration storage, but hydrogen-integrated rural systems remain capital-intensive, as shown by Ali, et al.
| [18] | M. F. Ali, M. E. Azam, D. Biswas, N. Sarkar, and M. A. Razzak, "Techno-Economic Evaluation of a Hydrogen-Integrated Hybrid Renewable Microgrid for Rural Electrification," in 2025 International Conference on Modern Sustainable Systems (CMSS), 2025: IEEE, 860–865.
https://doi.org/10.1109/CMSS66566.2025.11182361 |
[18]
and related hydrogen-storage studies.
2.2. Cost-Centered Optimization and Its Limitations
Most hybrid microgrid studies use hybrid optimization model for electric renewables (HOMER) or HOMER-like simulation environments because they allow hourly energy-balance simulation, component sizing, net present cost estimation, and sensitivity analysis
| [6] | H. Akter, H. O. R. Howlader, F. Mamud, A. Y. Saber, A. Yona, and T. Senjyu, "Optimal sizing and performance analysis of hybrid microgrid for remote island of developing country: Effect of sustainable parameters, benefits and installation barriers," Franklin Open, 2024, 6, 100074–100074.
https://doi.org/10.1016/j.fraope.2024.100074 |
| [9] | S. Vendoti, M. Muralidhar, and R. Kiranmayi, "Techno-economic analysis of off-grid solar/wind/biogas/biomass/fuel cell/battery system for electrification in a cluster of villages by HOMER software," Environment, Development and Sustainability, 2021, 23(1), 351–372.
https://doi.org/10.1007/s10668-019-00583-2 |
[6, 9]
. HOMER-based approaches have been used to compare rural hybrid systems in India, Bangladesh, Nigeria, and remote island settings
| [3] | T. O. Araoye, E. C. Ashigwuike, M. J. Mbunwe, O. I. Bakinson, and T. I. Ozue, "Techno-economic modeling and optimal sizing of autonomous hybrid microgrid renewable energy system for rural electrification sustainability using HOMER and grasshopper optimization algorithm," Renewable Energy, 2024, 229, 120712–120712. https://doi.org/10.1016/j.renene.2024.120712 |
| [6] | H. Akter, H. O. R. Howlader, F. Mamud, A. Y. Saber, A. Yona, and T. Senjyu, "Optimal sizing and performance analysis of hybrid microgrid for remote island of developing country: Effect of sustainable parameters, benefits and installation barriers," Franklin Open, 2024, 6, 100074–100074.
https://doi.org/10.1016/j.fraope.2024.100074 |
| [9] | S. Vendoti, M. Muralidhar, and R. Kiranmayi, "Techno-economic analysis of off-grid solar/wind/biogas/biomass/fuel cell/battery system for electrification in a cluster of villages by HOMER software," Environment, Development and Sustainability, 2021, 23(1), 351–372.
https://doi.org/10.1007/s10668-019-00583-2 |
[3, 6, 9]
. Other studies combine simulation with metaheuristic optimization. Araoye, et al.
| [3] | T. O. Araoye, E. C. Ashigwuike, M. J. Mbunwe, O. I. Bakinson, and T. I. Ozue, "Techno-economic modeling and optimal sizing of autonomous hybrid microgrid renewable energy system for rural electrification sustainability using HOMER and grasshopper optimization algorithm," Renewable Energy, 2024, 229, 120712–120712. https://doi.org/10.1016/j.renene.2024.120712 |
[3]
applied grasshopper optimization to autonomous Nigerian microgrid sizing, while Bilal, et al.
| [11] | M. Bilal, P. N. Bokoro, and G. Sharma, "Hybrid optimization for sustainable design and sizing of standalone microgrids integrating renewable energy, diesel generators, and battery storage with environmental considerations," Results in Engineering, 2025, 25, 103764–103764.
https://doi.org/10.1016/j.rineng.2024.103764 |
[11]
used hybrid optimization for standalone systems integrating renewables, diesel, and battery storage. Khalid, et al.
| [10] | W. Khalid, Q. Awais, M. Jamil, and A. A. Khan, "Dynamic Simulation and Optimization of Off-Grid Hybrid Power Systems for Sustainable Rural Development," Electronics, 2024, 13(13), 2487–2487.
https://doi.org/10.3390/electronics13132487 |
[10]
used dynamic simulation and optimization for rural off-grid systems.
The most common objective functions in this literature are NPC and LCOE
| [9] | S. Vendoti, M. Muralidhar, and R. Kiranmayi, "Techno-economic analysis of off-grid solar/wind/biogas/biomass/fuel cell/battery system for electrification in a cluster of villages by HOMER software," Environment, Development and Sustainability, 2021, 23(1), 351–372.
https://doi.org/10.1007/s10668-019-00583-2 |
| [10] | W. Khalid, Q. Awais, M. Jamil, and A. A. Khan, "Dynamic Simulation and Optimization of Off-Grid Hybrid Power Systems for Sustainable Rural Development," Electronics, 2024, 13(13), 2487–2487.
https://doi.org/10.3390/electronics13132487 |
| [11] | M. Bilal, P. N. Bokoro, and G. Sharma, "Hybrid optimization for sustainable design and sizing of standalone microgrids integrating renewable energy, diesel generators, and battery storage with environmental considerations," Results in Engineering, 2025, 25, 103764–103764.
https://doi.org/10.1016/j.rineng.2024.103764 |
[9-11]
. Renewable fraction and emissions are sometimes included as constraints or secondary objectives, but affordability under uncertainty and differentiated supply security are less commonly treated as co-equal planning goals
| [7] | J. J. Bouendeu, F. A. Talla Konchou, M. N. B. Astrid, M. F. Elmorshedy, and T. René, "A systematic techno-enviro-socio-economic design optimization and power quality of hybrid renewable microgrids," Renewable Energy, 2023, 218, 119297–119297. https://doi.org/10.1016/j.renene.2023.119297 |
| [12] | T. K. Roy, M. A. Mahmud, and A. M. T. Oo, "Techno-economic feasibility of stand-alone hybrid energy systems for a remote Australian community: Optimization and sensitivity analysis," Renewable Energy, 241, 122286–122286.
https://doi.org/10.1016/j.renene.2024.122286 |
[7, 12]
. While cost optimization is necessary, it is insufficient for rural energy planning. A system with low base-case LCOE may perform poorly under fuel-price shocks, demand growth, component failure, or poor renewable-resource years
| [12] | T. K. Roy, M. A. Mahmud, and A. M. T. Oo, "Techno-economic feasibility of stand-alone hybrid energy systems for a remote Australian community: Optimization and sensitivity analysis," Renewable Energy, 241, 122286–122286.
https://doi.org/10.1016/j.renene.2024.122286 |
| [13] | M. Salehi, M. Khanali, and H. Ghasemi-Mobtaker, "Techno-economic analysis of renewable hybrid system microgrids for minimizing grid power outages in residential areas," Cleaner Engineering and Technology, 2025, 25, 100924–100924.
https://doi.org/10.1016/j.clet.2025.100924 |
[12, 13]
. Similarly, a system may meet aggregate reliability targets while failing to prioritize critical services such as clinics, water pumps, and security lighting.
Sensitivity analysis is therefore important, but it is often reported mainly as a cost deviation. Roy, et al.
| [12] | T. K. Roy, M. A. Mahmud, and A. M. T. Oo, "Techno-economic feasibility of stand-alone hybrid energy systems for a remote Australian community: Optimization and sensitivity analysis," Renewable Energy, 241, 122286–122286.
https://doi.org/10.1016/j.renene.2024.122286 |
[12]
and Salehi, et al.
| [13] | M. Salehi, M. Khanali, and H. Ghasemi-Mobtaker, "Techno-economic analysis of renewable hybrid system microgrids for minimizing grid power outages in residential areas," Cleaner Engineering and Technology, 2025, 25, 100924–100924.
https://doi.org/10.1016/j.clet.2025.100924 |
[13]
show the importance of sensitivity analysis in hybrid system planning, yet rural security-oriented planning requires sensitivity to be interpreted through reliability, autonomy, payback stability, and exposure of critical loads. This motivates the RSES framework developed in this paper.
2.3. Reliability, Resilience, and Energy Security
Reliability is commonly represented using LPSP, unmet load, or availability
| [8] | A. Razmjoo, R. Shirmohammadi, A. Davarpanah, F. Pourfayaz, and A. Aslani, "Stand-alone hybrid energy systems for remote area power generation," Energy Reports, 2019, 5, 231–241.
https://doi.org/10.1016/j.egyr.2019.01.010 |
| [9] | S. Vendoti, M. Muralidhar, and R. Kiranmayi, "Techno-economic analysis of off-grid solar/wind/biogas/biomass/fuel cell/battery system for electrification in a cluster of villages by HOMER software," Environment, Development and Sustainability, 2021, 23(1), 351–372.
https://doi.org/10.1007/s10668-019-00583-2 |
[8, 9]
. Razmjoo, et al.
| [8] | A. Razmjoo, R. Shirmohammadi, A. Davarpanah, F. Pourfayaz, and A. Aslani, "Stand-alone hybrid energy systems for remote area power generation," Energy Reports, 2019, 5, 231–241.
https://doi.org/10.1016/j.egyr.2019.01.010 |
[8]
framed standalone hybrid systems as suitable solutions for remote-area power generation, with reliability treated as a key technical condition. However, aggregate reliability metrics do not fully capture rural security needs. One hour of outage affecting a clinic vaccine refrigerator or a community water pump has a different social consequence from one hour of outage affecting domestic television loads
| [5] | N. Kumar, K. Namrata, and A. Samadhiya, "Techno socio-economic analysis and stratified assessment of hybrid renewable energy systems for electrification of rural community," Sustainable Energy Technologies and Assessments, 2023, 55, 102950–102950. https://doi.org/10.1016/j.seta.2022.102950 |
| [7] | J. J. Bouendeu, F. A. Talla Konchou, M. N. B. Astrid, M. F. Elmorshedy, and T. René, "A systematic techno-enviro-socio-economic design optimization and power quality of hybrid renewable microgrids," Renewable Energy, 2023, 218, 119297–119297. https://doi.org/10.1016/j.renene.2023.119297 |
[5, 7]
.
Recent studies increasingly recognize the need to include resilience, autonomy, power quality, and critical-load continuity. Bouendeu, et al.
| [7] | J. J. Bouendeu, F. A. Talla Konchou, M. N. B. Astrid, M. F. Elmorshedy, and T. René, "A systematic techno-enviro-socio-economic design optimization and power quality of hybrid renewable microgrids," Renewable Energy, 2023, 218, 119297–119297. https://doi.org/10.1016/j.renene.2023.119297 |
[7]
, for example, incorporated techno-enviro-socio-economic criteria and power-quality considerations in hybrid microgrid optimization. Akter, et al.
| [6] | H. Akter, H. O. R. Howlader, F. Mamud, A. Y. Saber, A. Yona, and T. Senjyu, "Optimal sizing and performance analysis of hybrid microgrid for remote island of developing country: Effect of sustainable parameters, benefits and installation barriers," Franklin Open, 2024, 6, 100074–100074.
https://doi.org/10.1016/j.fraope.2024.100074 |
[6]
also emphasized installation barriers and performance constraints in remote island microgrids. However, many studies still do not integrate security and affordability into a single decision structure that planners can use to rank competing architectures. The RSES framework responds to this gap by combining LPSP, autonomy, LCOE, payback dispersion, renewable fraction, and avoiding emissions in a single normalized index.
2.4. Socio-Economic Coupling and Productive Use
Electricity access contributes to rural income growth when it supports productive uses such as milling, refrigeration, irrigation, charging services, welding, digital services, and small manufacturing
| [1] | T. Zhang, X. Shi, D. Zhang, and J. Xiao, "Socio-economic development and electricity access in developing economies: A long-run model averaging approach," Energy Policy, 2019, 132, 223–231. https://doi.org/10.1016/j.enpol.2019.05.031 |
| [5] | N. Kumar, K. Namrata, and A. Samadhiya, "Techno socio-economic analysis and stratified assessment of hybrid renewable energy systems for electrification of rural community," Sustainable Energy Technologies and Assessments, 2023, 55, 102950–102950. https://doi.org/10.1016/j.seta.2022.102950 |
[1, 5]
. Zhang, et al.
| [1] | T. Zhang, X. Shi, D. Zhang, and J. Xiao, "Socio-economic development and electricity access in developing economies: A long-run model averaging approach," Energy Policy, 2019, 132, 223–231. https://doi.org/10.1016/j.enpol.2019.05.031 |
[1]
provide long-run cross-country evidence linking electricity access with socio-economic development in developing economies. However, many microgrid sizing studies treat load as a fixed technical profile rather than a development pathway. Productive-use demand is either excluded or added after the design stage
| [5] | N. Kumar, K. Namrata, and A. Samadhiya, "Techno socio-economic analysis and stratified assessment of hybrid renewable energy systems for electrification of rural community," Sustainable Energy Technologies and Assessments, 2023, 55, 102950–102950. https://doi.org/10.1016/j.seta.2022.102950 |
| [6] | H. Akter, H. O. R. Howlader, F. Mamud, A. Y. Saber, A. Yona, and T. Senjyu, "Optimal sizing and performance analysis of hybrid microgrid for remote island of developing country: Effect of sustainable parameters, benefits and installation barriers," Franklin Open, 2024, 6, 100074–100074.
https://doi.org/10.1016/j.fraope.2024.100074 |
[5, 6]
.
Kumar, et al.
| [5] | N. Kumar, K. Namrata, and A. Samadhiya, "Techno socio-economic analysis and stratified assessment of hybrid renewable energy systems for electrification of rural community," Sustainable Energy Technologies and Assessments, 2023, 55, 102950–102950. https://doi.org/10.1016/j.seta.2022.102950 |
[5]
explicitly considered stratified socio-economic assessment for rural hybrid renewable systems, while Akter, et al.
| [6] | H. Akter, H. O. R. Howlader, F. Mamud, A. Y. Saber, A. Yona, and T. Senjyu, "Optimal sizing and performance analysis of hybrid microgrid for remote island of developing country: Effect of sustainable parameters, benefits and installation barriers," Franklin Open, 2024, 6, 100074–100074.
https://doi.org/10.1016/j.fraope.2024.100074 |
[6]
and Ali, et al.
| [15] | M. F. Ali, M. R. I. Sheikh, R. Akter, K. M. N. Islam, and A. H. M. I. Ferdous, "Grid-connected hybrid microgrids with PV/wind/battery: Sustainable energy solutions for rural education in Bangladesh," Results in Engineering, 2025, 25, 103774–103774. https://doi.org/10.1016/j.rineng.2024.103774 |
[15]
included community and institutional loads in developing-country contexts. These studies support the argument that rural microgrid design should distinguish between critical, productive, and domestic loads. This is especially important for Nigeria, where rural electrification programmes increasingly aim to support local enterprise, agricultural value chains, water access, and community safety
| [2] | W. B. I. I. U. WHO., "Tracking SDG 7: The Energy Progress Report 2024," Washington, D. C, 2024. [Online]. Available:
http://documents.worldbank.org/curated/en/099031225175211404 |
| [3] | T. O. Araoye, E. C. Ashigwuike, M. J. Mbunwe, O. I. Bakinson, and T. I. Ozue, "Techno-economic modeling and optimal sizing of autonomous hybrid microgrid renewable energy system for rural electrification sustainability using HOMER and grasshopper optimization algorithm," Renewable Energy, 2024, 229, 120712–120712. https://doi.org/10.1016/j.renene.2024.120712 |
[2, 3]
.
2.5. Gaps Addressed by This Study
The reviewed literature shows four recurring gaps. First, many studies provide limited cross-architecture comparability across PV/wind/battery, diesel-assisted, hydrogen-assisted, and biomass-assisted designs
| [3] | T. O. Araoye, E. C. Ashigwuike, M. J. Mbunwe, O. I. Bakinson, and T. I. Ozue, "Techno-economic modeling and optimal sizing of autonomous hybrid microgrid renewable energy system for rural electrification sustainability using HOMER and grasshopper optimization algorithm," Renewable Energy, 2024, 229, 120712–120712. https://doi.org/10.1016/j.renene.2024.120712 |
| [9] | S. Vendoti, M. Muralidhar, and R. Kiranmayi, "Techno-economic analysis of off-grid solar/wind/biogas/biomass/fuel cell/battery system for electrification in a cluster of villages by HOMER software," Environment, Development and Sustainability, 2021, 23(1), 351–372.
https://doi.org/10.1007/s10668-019-00583-2 |
| [18] | M. F. Ali, M. E. Azam, D. Biswas, N. Sarkar, and M. A. Razzak, "Techno-Economic Evaluation of a Hydrogen-Integrated Hybrid Renewable Microgrid for Rural Electrification," in 2025 International Conference on Modern Sustainable Systems (CMSS), 2025: IEEE, 860–865.
https://doi.org/10.1109/CMSS66566.2025.11182361 |
[3, 9, 18]
. Second, reliability is often treated mainly as a constraint rather than a co-equal objective
| [8] | A. Razmjoo, R. Shirmohammadi, A. Davarpanah, F. Pourfayaz, and A. Aslani, "Stand-alone hybrid energy systems for remote area power generation," Energy Reports, 2019, 5, 231–241.
https://doi.org/10.1016/j.egyr.2019.01.010 |
| [11] | M. Bilal, P. N. Bokoro, and G. Sharma, "Hybrid optimization for sustainable design and sizing of standalone microgrids integrating renewable energy, diesel generators, and battery storage with environmental considerations," Results in Engineering, 2025, 25, 103764–103764.
https://doi.org/10.1016/j.rineng.2024.103764 |
[8, 11]
. Third, affordability and payback stability under shocks are weakly modelled, even though fuel-price volatility and demand growth are central planning risks in rural systems
| [12] | T. K. Roy, M. A. Mahmud, and A. M. T. Oo, "Techno-economic feasibility of stand-alone hybrid energy systems for a remote Australian community: Optimization and sensitivity analysis," Renewable Energy, 241, 122286–122286.
https://doi.org/10.1016/j.renene.2024.122286 |
| [13] | M. Salehi, M. Khanali, and H. Ghasemi-Mobtaker, "Techno-economic analysis of renewable hybrid system microgrids for minimizing grid power outages in residential areas," Cleaner Engineering and Technology, 2025, 25, 100924–100924.
https://doi.org/10.1016/j.clet.2025.100924 |
[12, 13]
. Fourth, many studies lack a structured, transferable workflow that rural planners can adapt to different communities
| [5] | N. Kumar, K. Namrata, and A. Samadhiya, "Techno socio-economic analysis and stratified assessment of hybrid renewable energy systems for electrification of rural community," Sustainable Energy Technologies and Assessments, 2023, 55, 102950–102950. https://doi.org/10.1016/j.seta.2022.102950 |
| [7] | J. J. Bouendeu, F. A. Talla Konchou, M. N. B. Astrid, M. F. Elmorshedy, and T. René, "A systematic techno-enviro-socio-economic design optimization and power quality of hybrid renewable microgrids," Renewable Energy, 2023, 218, 119297–119297. https://doi.org/10.1016/j.renene.2023.119297 |
[5, 7]
.
This paper addresses these gaps by introducing a rural security–economic stability framework that combines multi-criteria scoring, tiered-load reliability, explicit payback dispersion, annual energy-balance reporting, and stress testing.
3. The Rural Security–Economic Stability Framework
3.1. Framework Overview
The RSES framework reorganizes rural microgrid design around three co-equal objectives: security of supply, economic stability, and socio-environmental performance. This multi-dimensional structure is consistent with recent techno-socio-economic microgrid studies that argue against relying on cost alone when planning rural energy systems
| [5] | N. Kumar, K. Namrata, and A. Samadhiya, "Techno socio-economic analysis and stratified assessment of hybrid renewable energy systems for electrification of rural community," Sustainable Energy Technologies and Assessments, 2023, 55, 102950–102950. https://doi.org/10.1016/j.seta.2022.102950 |
| [7] | J. J. Bouendeu, F. A. Talla Konchou, M. N. B. Astrid, M. F. Elmorshedy, and T. René, "A systematic techno-enviro-socio-economic design optimization and power quality of hybrid renewable microgrids," Renewable Energy, 2023, 218, 119297–119297. https://doi.org/10.1016/j.renene.2023.119297 |
[5, 7]
. In the RSES framework, security of supply refers to the ability to meet demand, especially critical loads, with low unmet energy and adequate autonomy. Economic stability refers to affordability of delivered energy and stability of payback under shocks. Socio-environmental performance refers to renewable fraction and avoided carbon emissions.
The framework proceeds through five stages: resource profiling, load stratification, component sizing, multi-scenario optimization, and resilience stress-testing. Similar staged approaches are common in HOMER-type microgrid planning, but the RSES framework makes load-tier security and shock-induced affordability explicit decision criteria rather than post-processing observations
| [6] | H. Akter, H. O. R. Howlader, F. Mamud, A. Y. Saber, A. Yona, and T. Senjyu, "Optimal sizing and performance analysis of hybrid microgrid for remote island of developing country: Effect of sustainable parameters, benefits and installation barriers," Franklin Open, 2024, 6, 100074–100074.
https://doi.org/10.1016/j.fraope.2024.100074 |
| [9] | S. Vendoti, M. Muralidhar, and R. Kiranmayi, "Techno-economic analysis of off-grid solar/wind/biogas/biomass/fuel cell/battery system for electrification in a cluster of villages by HOMER software," Environment, Development and Sustainability, 2021, 23(1), 351–372.
https://doi.org/10.1007/s10668-019-00583-2 |
| [12] | T. K. Roy, M. A. Mahmud, and A. M. T. Oo, "Techno-economic feasibility of stand-alone hybrid energy systems for a remote Australian community: Optimization and sensitivity analysis," Renewable Energy, 241, 122286–122286.
https://doi.org/10.1016/j.renene.2024.122286 |
[6, 9, 12]
.
Figure 1. RSES five-stage framework.
The framework begins with solar, wind, biomass, and diesel-logistics profiling; proceeds to tiered load classification; generates feasible component combinations; evaluates each architecture using hourly simulation and NPC minimization; and finally, stress-tests the selected architectures under diesel-price, solar-resource, and demand shocks.
3.2. RSES Decision Index
The composite RSES score is defined as:
where:
and:
= security sub-index;
= economic-stability sub-index;
= socio-environmental sub-index.
For the base case, the weights are:
(3)
The weighting approach follows the logic of multi-criteria energy-planning methods, where planners assign relative importance to cost, reliability, emissions, and social priorities
| [5] | N. Kumar, K. Namrata, and A. Samadhiya, "Techno socio-economic analysis and stratified assessment of hybrid renewable energy systems for electrification of rural community," Sustainable Energy Technologies and Assessments, 2023, 55, 102950–102950. https://doi.org/10.1016/j.seta.2022.102950 |
| [7] | J. J. Bouendeu, F. A. Talla Konchou, M. N. B. Astrid, M. F. Elmorshedy, and T. René, "A systematic techno-enviro-socio-economic design optimization and power quality of hybrid renewable microgrids," Renewable Energy, 2023, 218, 119297–119297. https://doi.org/10.1016/j.renene.2023.119297 |
[5, 7]
. In this study, supply security and affordability are weighted more strongly than socio-environmental performance because rural Nigerian microgrids must first deliver reliable and financially tolerable service to critical and productive users
| [2] | W. B. I. I. U. WHO., "Tracking SDG 7: The Energy Progress Report 2024," Washington, D. C, 2024. [Online]. Available:
http://documents.worldbank.org/curated/en/099031225175211404 |
| [3] | T. O. Araoye, E. C. Ashigwuike, M. J. Mbunwe, O. I. Bakinson, and T. I. Ozue, "Techno-economic modeling and optimal sizing of autonomous hybrid microgrid renewable energy system for rural electrification sustainability using HOMER and grasshopper optimization algorithm," Renewable Energy, 2024, 229, 120712–120712. https://doi.org/10.1016/j.renene.2024.120712 |
[2, 3]
.
3.3. Security Sub-Index
The security sub-index combines aggregate LPSP and autonomy hours:
(4)
where:
= aggregate loss of power supply probability;
, corresponding to a maximum acceptable aggregate LPSP of 5%;
= effective autonomy hours provided by usable storage and firm dispatchable backup;
h;
;
.
The LPSP component follows common hybrid-system reliability practice
| [8] | A. Razmjoo, R. Shirmohammadi, A. Davarpanah, F. Pourfayaz, and A. Aslani, "Stand-alone hybrid energy systems for remote area power generation," Energy Reports, 2019, 5, 231–241.
https://doi.org/10.1016/j.egyr.2019.01.010 |
| [9] | S. Vendoti, M. Muralidhar, and R. Kiranmayi, "Techno-economic analysis of off-grid solar/wind/biogas/biomass/fuel cell/battery system for electrification in a cluster of villages by HOMER software," Environment, Development and Sustainability, 2021, 23(1), 351–372.
https://doi.org/10.1007/s10668-019-00583-2 |
[8, 9]
, while autonomy is included because critical rural services require continuity through evening peaks, cloudy periods, and backup-fuel disruptions
| [6] | H. Akter, H. O. R. Howlader, F. Mamud, A. Y. Saber, A. Yona, and T. Senjyu, "Optimal sizing and performance analysis of hybrid microgrid for remote island of developing country: Effect of sustainable parameters, benefits and installation barriers," Franklin Open, 2024, 6, 100074–100074.
https://doi.org/10.1016/j.fraope.2024.100074 |
| [7] | J. J. Bouendeu, F. A. Talla Konchou, M. N. B. Astrid, M. F. Elmorshedy, and T. René, "A systematic techno-enviro-socio-economic design optimization and power quality of hybrid renewable microgrids," Renewable Energy, 2023, 218, 119297–119297. https://doi.org/10.1016/j.renene.2023.119297 |
[6, 7]
. The ratio
is capped at 1, and all sub-indices are clipped to the interval
| [1] | T. Zhang, X. Shi, D. Zhang, and J. Xiao, "Socio-economic development and electricity access in developing economies: A long-run model averaging approach," Energy Policy, 2019, 132, 223–231. https://doi.org/10.1016/j.enpol.2019.05.031 |
[1]
.
3.4. Economic-Stability Sub-Index
The economic-stability sub-index combines LCOE and payback dispersion:
(5)
where:
= levelised cost of energy;
;
= standard deviation of payback period across shock scenarios;
years;
;
.
LCOE is widely used in hybrid microgrid studies because it provides a comparable measure of delivered energy cost across architectures
| [9] | S. Vendoti, M. Muralidhar, and R. Kiranmayi, "Techno-economic analysis of off-grid solar/wind/biogas/biomass/fuel cell/battery system for electrification in a cluster of villages by HOMER software," Environment, Development and Sustainability, 2021, 23(1), 351–372.
https://doi.org/10.1007/s10668-019-00583-2 |
| [10] | W. Khalid, Q. Awais, M. Jamil, and A. A. Khan, "Dynamic Simulation and Optimization of Off-Grid Hybrid Power Systems for Sustainable Rural Development," Electronics, 2024, 13(13), 2487–2487.
https://doi.org/10.3390/electronics13132487 |
| [11] | M. Bilal, P. N. Bokoro, and G. Sharma, "Hybrid optimization for sustainable design and sizing of standalone microgrids integrating renewable energy, diesel generators, and battery storage with environmental considerations," Results in Engineering, 2025, 25, 103764–103764.
https://doi.org/10.1016/j.rineng.2024.103764 |
[9-11]
. However, rural investors and communities also face uncertainty in cost recovery under fuel-price, demand, and renewable-resource shocks. Payback dispersion is therefore included to represent economic stability, which is often absent from conventional LCOE-focused studies
| [12] | T. K. Roy, M. A. Mahmud, and A. M. T. Oo, "Techno-economic feasibility of stand-alone hybrid energy systems for a remote Australian community: Optimization and sensitivity analysis," Renewable Energy, 241, 122286–122286.
https://doi.org/10.1016/j.renene.2024.122286 |
| [13] | M. Salehi, M. Khanali, and H. Ghasemi-Mobtaker, "Techno-economic analysis of renewable hybrid system microgrids for minimizing grid power outages in residential areas," Cleaner Engineering and Technology, 2025, 25, 100924–100924.
https://doi.org/10.1016/j.clet.2025.100924 |
[12, 13]
.
Payback dispersion is defined as:
where is the payback period under shock scenario , is the mean payback period, and is the number of simulated shock cases.
3.5. Socio-Environmental Sub-Index
The socio-environmental sub-index combines renewable fraction and avoided emissions:
(7)
where:
= renewable fraction;
= annual avoided emissions relative to a diesel-only baseline;
tCO₂/year for this case; ; .
Renewable fraction and emissions reduction are standard sustainability indicators in hybrid renewable microgrid planning
| [8] | A. Razmjoo, R. Shirmohammadi, A. Davarpanah, F. Pourfayaz, and A. Aslani, "Stand-alone hybrid energy systems for remote area power generation," Energy Reports, 2019, 5, 231–241.
https://doi.org/10.1016/j.egyr.2019.01.010 |
| [9] | S. Vendoti, M. Muralidhar, and R. Kiranmayi, "Techno-economic analysis of off-grid solar/wind/biogas/biomass/fuel cell/battery system for electrification in a cluster of villages by HOMER software," Environment, Development and Sustainability, 2021, 23(1), 351–372.
https://doi.org/10.1007/s10668-019-00583-2 |
| [11] | M. Bilal, P. N. Bokoro, and G. Sharma, "Hybrid optimization for sustainable design and sizing of standalone microgrids integrating renewable energy, diesel generators, and battery storage with environmental considerations," Results in Engineering, 2025, 25, 103764–103764.
https://doi.org/10.1016/j.rineng.2024.103764 |
[8, 9, 11]
. They are included here not as stand-alone objectives but as part of a broader rural-security and economic-stability evaluation. This is important because a high-renewable system may still be unsuitable if it is unaffordable or fails critical loads, while a low-cost diesel-assisted system may be vulnerable to fuel-price escalation and emissions penalties
| [3] | T. O. Araoye, E. C. Ashigwuike, M. J. Mbunwe, O. I. Bakinson, and T. I. Ozue, "Techno-economic modeling and optimal sizing of autonomous hybrid microgrid renewable energy system for rural electrification sustainability using HOMER and grasshopper optimization algorithm," Renewable Energy, 2024, 229, 120712–120712. https://doi.org/10.1016/j.renene.2024.120712 |
| [12] | T. K. Roy, M. A. Mahmud, and A. M. T. Oo, "Techno-economic feasibility of stand-alone hybrid energy systems for a remote Australian community: Optimization and sensitivity analysis," Renewable Energy, 241, 122286–122286.
https://doi.org/10.1016/j.renene.2024.122286 |
[3, 12]
.
3.6. Justification of Normalization Constants
The normalization constants are selected to make the index interpretable for rural planning. The value
is used as a conservative affordability ceiling for isolated rural electricity, where the alternative is often diesel self-generation, kerosene lighting, phone-charging vendors, or unreliable grid supply
. The value
years represents a high but tolerable dispersion in project recovery time under shocks; above this level, payback uncertainty becomes difficult for communities, developers, and financiers to absorb
| [12] | T. K. Roy, M. A. Mahmud, and A. M. T. Oo, "Techno-economic feasibility of stand-alone hybrid energy systems for a remote Australian community: Optimization and sensitivity analysis," Renewable Energy, 241, 122286–122286.
https://doi.org/10.1016/j.renene.2024.122286 |
| [13] | M. Salehi, M. Khanali, and H. Ghasemi-Mobtaker, "Techno-economic analysis of renewable hybrid system microgrids for minimizing grid power outages in residential areas," Cleaner Engineering and Technology, 2025, 25, 100924–100924.
https://doi.org/10.1016/j.clet.2025.100924 |
[12, 13]
. The value
h reflects a practical one-day autonomy benchmark for rural critical loads, consistent with the need to sustain clinics, water pumping, and security lighting during short-term resource or fuel interruptions
| [6] | H. Akter, H. O. R. Howlader, F. Mamud, A. Y. Saber, A. Yona, and T. Senjyu, "Optimal sizing and performance analysis of hybrid microgrid for remote island of developing country: Effect of sustainable parameters, benefits and installation barriers," Franklin Open, 2024, 6, 100074–100074.
https://doi.org/10.1016/j.fraope.2024.100074 |
| [7] | J. J. Bouendeu, F. A. Talla Konchou, M. N. B. Astrid, M. F. Elmorshedy, and T. René, "A systematic techno-enviro-socio-economic design optimization and power quality of hybrid renewable microgrids," Renewable Energy, 2023, 218, 119297–119297. https://doi.org/10.1016/j.renene.2023.119297 |
[6, 7]
. The value
tCO₂/year is derived from the estimated annual emissions of a diesel-only baseline serving the same load, following the common practice of comparing renewable microgrids against fossil-fuel baselines
| [9] | S. Vendoti, M. Muralidhar, and R. Kiranmayi, "Techno-economic analysis of off-grid solar/wind/biogas/biomass/fuel cell/battery system for electrification in a cluster of villages by HOMER software," Environment, Development and Sustainability, 2021, 23(1), 351–372.
https://doi.org/10.1007/s10668-019-00583-2 |
| [11] | M. Bilal, P. N. Bokoro, and G. Sharma, "Hybrid optimization for sustainable design and sizing of standalone microgrids integrating renewable energy, diesel generators, and battery storage with environmental considerations," Results in Engineering, 2025, 25, 103764–103764.
https://doi.org/10.1016/j.rineng.2024.103764 |
[9, 11]
.
4. Methodology and Case Implementation
4.1. Case-Study Definition
The case study is a synthetic representative rural cluster parameterized using Northern Nigerian solar-resource conditions, published rural-load assumptions, and typical component-cost values from the hybrid microgrid literature. This approach is similar to representative-case modelling used in rural hybrid microgrid studies when measured village-level data are unavailable or when the purpose is to test a transferable planning framework rather than optimize a single surveyed site
| [3] | T. O. Araoye, E. C. Ashigwuike, M. J. Mbunwe, O. I. Bakinson, and T. I. Ozue, "Techno-economic modeling and optimal sizing of autonomous hybrid microgrid renewable energy system for rural electrification sustainability using HOMER and grasshopper optimization algorithm," Renewable Energy, 2024, 229, 120712–120712. https://doi.org/10.1016/j.renene.2024.120712 |
| [5] | N. Kumar, K. Namrata, and A. Samadhiya, "Techno socio-economic analysis and stratified assessment of hybrid renewable energy systems for electrification of rural community," Sustainable Energy Technologies and Assessments, 2023, 55, 102950–102950. https://doi.org/10.1016/j.seta.2022.102950 |
[3, 5]
. The case is not presented as a surveyed single village.
The representative location is parameterized around a Northern Nigerian coordinate band close to
,
. This coordinate band is used only to generate representative solar and wind resource conditions from NASA POWER-type data; the study does not claim to represent a specific surveyed community
| [19] | NASAPOWER, "Prediction of Worldwide Energy Resources: Data access viewer," in National Aeronautics and Space Administration, ed, 2026. |
[19]
. The settlement is assumed to include 180 households, one primary health post, one primary school, one borehole pump, two agro-processing enterprises, one small cold-storage unit, and communal security lighting. These load categories are consistent with productive-use and institutional-load structures discussed in rural microgrid studies
| [5] | N. Kumar, K. Namrata, and A. Samadhiya, "Techno socio-economic analysis and stratified assessment of hybrid renewable energy systems for electrification of rural community," Sustainable Energy Technologies and Assessments, 2023, 55, 102950–102950. https://doi.org/10.1016/j.seta.2022.102950 |
| [6] | H. Akter, H. O. R. Howlader, F. Mamud, A. Y. Saber, A. Yona, and T. Senjyu, "Optimal sizing and performance analysis of hybrid microgrid for remote island of developing country: Effect of sustainable parameters, benefits and installation barriers," Franklin Open, 2024, 6, 100074–100074.
https://doi.org/10.1016/j.fraope.2024.100074 |
| [15] | M. F. Ali, M. R. I. Sheikh, R. Akter, K. M. N. Islam, and A. H. M. I. Ferdous, "Grid-connected hybrid microgrids with PV/wind/battery: Sustainable energy solutions for rural education in Bangladesh," Results in Engineering, 2025, 25, 103774–103774. https://doi.org/10.1016/j.rineng.2024.103774 |
[5, 6, 15]
.
The average daily demand is:
The annual demand is:
(9)
The evening peak demand is approximately 68 kW. Annual demand growth is assumed at 3%, reflecting the likelihood that productive-use electricity demand grows after improved supply becomes available
| [1] | T. Zhang, X. Shi, D. Zhang, and J. Xiao, "Socio-economic development and electricity access in developing economies: A long-run model averaging approach," Energy Policy, 2019, 132, 223–231. https://doi.org/10.1016/j.enpol.2019.05.031 |
| [5] | N. Kumar, K. Namrata, and A. Samadhiya, "Techno socio-economic analysis and stratified assessment of hybrid renewable energy systems for electrification of rural community," Sustainable Energy Technologies and Assessments, 2023, 55, 102950–102950. https://doi.org/10.1016/j.seta.2022.102950 |
[1, 5]
.
4.2. Load Stratification and Hourly Profile
Loads are divided into three tiers: critical, productive, and domestic as shown in
Table 1. This follows the argument that rural energy planning should distinguish between services with different social consequences of interruption rather than treating village demand as one homogeneous aggregate load
| [5] | N. Kumar, K. Namrata, and A. Samadhiya, "Techno socio-economic analysis and stratified assessment of hybrid renewable energy systems for electrification of rural community," Sustainable Energy Technologies and Assessments, 2023, 55, 102950–102950. https://doi.org/10.1016/j.seta.2022.102950 |
| [7] | J. J. Bouendeu, F. A. Talla Konchou, M. N. B. Astrid, M. F. Elmorshedy, and T. René, "A systematic techno-enviro-socio-economic design optimization and power quality of hybrid renewable microgrids," Renewable Energy, 2023, 218, 119297–119297. https://doi.org/10.1016/j.renene.2023.119297 |
[5, 7]
.
Table 1. Stratified rural load assumptions.
Load tier | Main services | Energy demand | LPSP cap |
Critical | Clinic refrigeration, water pumping, security lighting | 42 kWh/day | ≤ 1% |
Productive | Milling, cold storage, charging, small enterprise | 148 kWh/day | ≤ 3% |
Domestic | Lighting, fans, television, phone charging | 220 kWh/day | ≤ 5% |
Total | — | 410 kWh/day | Aggregate ≤ 5% |
The hourly profile is synthesized from three normalized tier profiles. Critical loads operate throughout the day, with higher demand during evening security-lighting hours and morning water-pumping periods. Productive loads operate mainly between 08:00 and 18:00, with milling and cold storage loads extending into early evening. Domestic loads peak between 18:00 and 23:00. Similar evening-dominant domestic profiles and daytime productive-use profiles are commonly used in rural microgrid simulations
| [3] | T. O. Araoye, E. C. Ashigwuike, M. J. Mbunwe, O. I. Bakinson, and T. I. Ozue, "Techno-economic modeling and optimal sizing of autonomous hybrid microgrid renewable energy system for rural electrification sustainability using HOMER and grasshopper optimization algorithm," Renewable Energy, 2024, 229, 120712–120712. https://doi.org/10.1016/j.renene.2024.120712 |
| [9] | S. Vendoti, M. Muralidhar, and R. Kiranmayi, "Techno-economic analysis of off-grid solar/wind/biogas/biomass/fuel cell/battery system for electrification in a cluster of villages by HOMER software," Environment, Development and Sustainability, 2021, 23(1), 351–372.
https://doi.org/10.1007/s10668-019-00583-2 |
[3, 9]
. The profile is scaled so that annual energy equals 149,650 kWh/year and peak demand is 68 kW.
4.3. Resource Assumptions
The solar and wind assumptions are based on representative Northern Nigerian resource conditions. NASA POWER data are commonly used in renewable-energy feasibility studies to obtain solar irradiance, temperature, and wind-speed estimates where ground measurements are unavailable
| [6] | H. Akter, H. O. R. Howlader, F. Mamud, A. Y. Saber, A. Yona, and T. Senjyu, "Optimal sizing and performance analysis of hybrid microgrid for remote island of developing country: Effect of sustainable parameters, benefits and installation barriers," Franklin Open, 2024, 6, 100074–100074.
https://doi.org/10.1016/j.fraope.2024.100074 |
| [19] | NASAPOWER, "Prediction of Worldwide Energy Resources: Data access viewer," in National Aeronautics and Space Administration, ed, 2026. |
[6, 19]
. Biomass availability is represented using agricultural residues, consistent with rural hybrid microgrid studies that include biomass or biogas as dispatchable renewable resources
| [7] | J. J. Bouendeu, F. A. Talla Konchou, M. N. B. Astrid, M. F. Elmorshedy, and T. René, "A systematic techno-enviro-socio-economic design optimization and power quality of hybrid renewable microgrids," Renewable Energy, 2023, 218, 119297–119297. https://doi.org/10.1016/j.renene.2023.119297 |
| [9] | S. Vendoti, M. Muralidhar, and R. Kiranmayi, "Techno-economic analysis of off-grid solar/wind/biogas/biomass/fuel cell/battery system for electrification in a cluster of villages by HOMER software," Environment, Development and Sustainability, 2021, 23(1), 351–372.
https://doi.org/10.1007/s10668-019-00583-2 |
[7, 9]
. The resource assumptions in this respect are shown in
Table 2.
Table 2. Resource assumptions.
Resource | Assumed value | Source basis |
Mean global horizontal irradiance | 5.8 kWh/m²/day | NASA POWER-type Northern Nigerian value |
Mean wind speed at 10 m | 4.6 m/s | Regional wind-resource estimate |
Wind shear exponent | 0.20 | Rural open-terrain assumption |
Biomass availability | 1.6 t/day as-received residue | Agricultural residue estimate |
Biomass moisture assumption | 15% moisture | As-received feedstock basis |
Biomass feedstock cost | US$45/t | Collection, drying, and transport allowance |
Diesel price | US$1.05/L | Base case |
Diesel-price shock range | ±30% | Stress-test assumption |
Solar-resource shock range | ±20% | Stress-test assumption |
Demand shock range | ±30% | Stress-test assumption |
The diesel-price shock range is included because diesel-dependent rural systems are exposed to fuel-market volatility, a common concern in Nigerian and developing-country microgrid studies
| [3] | T. O. Araoye, E. C. Ashigwuike, M. J. Mbunwe, O. I. Bakinson, and T. I. Ozue, "Techno-economic modeling and optimal sizing of autonomous hybrid microgrid renewable energy system for rural electrification sustainability using HOMER and grasshopper optimization algorithm," Renewable Energy, 2024, 229, 120712–120712. https://doi.org/10.1016/j.renene.2024.120712 |
| [11] | M. Bilal, P. N. Bokoro, and G. Sharma, "Hybrid optimization for sustainable design and sizing of standalone microgrids integrating renewable energy, diesel generators, and battery storage with environmental considerations," Results in Engineering, 2025, 25, 103764–103764.
https://doi.org/10.1016/j.rineng.2024.103764 |
[3, 11]
.
4.4. Component Models
4.4.1 PV Output
PV output is modelled using a standard derating and temperature-correction relationship commonly applied in solar energy modelling and hybrid microgrid simulation
| [9] | S. Vendoti, M. Muralidhar, and R. Kiranmayi, "Techno-economic analysis of off-grid solar/wind/biogas/biomass/fuel cell/battery system for electrification in a cluster of villages by HOMER software," Environment, Development and Sustainability, 2021, 23(1), 351–372.
https://doi.org/10.1007/s10668-019-00583-2 |
| [20] | J. A. Duffie and W. A. Beckman, Solar Engineering of Thermal Processes. Wiley, 2013.
https://doi.org/10.1002/9781118671603 |
[9, 20]
, is given by Equation (
10).
(10)
where:
= installed PV capacity;
= derating factor;
= hourly irradiance;
;
;
.
The derating factor accounts for wiring losses, dust, mismatch, inverter-related losses, and other non-idealities, which are commonly considered in practical PV microgrid modelling
.
4.4.2 Wind Output
Wind turbine output is represented using a standard piecewise power curve, as commonly applied in hybrid wind microgrid studies
| [14] | T. K. Das and D. Kundu, "Feasibility and sensitivity analysis of a self-sustainable hybrid system: A case study of a mountainous region in Bangladesh," Energy Conversion and Management: X, 2023. 20, 100411–100411.
https://doi.org/10.1016/j.ecmx.2023.100411 |
| [21] | J. F. Manwell, J. G. McGowan, and A. L. Rogers, Wind Energy Explained. Wiley, 2009. |
[14, 21]
:
(11)
where:
;
;
.
Wind speed is extrapolated from 10 m to hub height using the power-law relationship:
The exponent of 0.20 is consistent with rural open-terrain assumptions used in preliminary wind-resource assessments
| [12] | T. K. Roy, M. A. Mahmud, and A. M. T. Oo, "Techno-economic feasibility of stand-alone hybrid energy systems for a remote Australian community: Optimization and sensitivity analysis," Renewable Energy, 241, 122286–122286.
https://doi.org/10.1016/j.renene.2024.122286 |
| [21] | J. F. Manwell, J. G. McGowan, and A. L. Rogers, Wind Energy Explained. Wiley, 2009. |
[12, 21]
.
4.4.3 Battery Model
Battery state of charge is updated hourly as:
(13)
where:
;
;
= battery charging power;
= battery discharging power;
= nominal battery capacity.
The SOC constraint is:
Lithium-iron-phosphate batteries are selected because they are increasingly used in renewable microgrids due to their cycle life, safety characteristics, and high round-trip efficiency
| [6] | H. Akter, H. O. R. Howlader, F. Mamud, A. Y. Saber, A. Yona, and T. Senjyu, "Optimal sizing and performance analysis of hybrid microgrid for remote island of developing country: Effect of sustainable parameters, benefits and installation barriers," Franklin Open, 2024, 6, 100074–100074.
https://doi.org/10.1016/j.fraope.2024.100074 |
| [11] | M. Bilal, P. N. Bokoro, and G. Sharma, "Hybrid optimization for sustainable design and sizing of standalone microgrids integrating renewable energy, diesel generators, and battery storage with environmental considerations," Results in Engineering, 2025, 25, 103764–103764.
https://doi.org/10.1016/j.rineng.2024.103764 |
[6, 11]
. The 20% minimum SOC protects battery lifetime and reflects common microgrid simulation practice.
4.4.4 Diesel Generator Model
The diesel generator fuel consumption is approximated as:
(15)
where:
= diesel consumption in L/h;
= rated generator capacity;
= generator output;
;
.
A minimum loading constraint of 30% is imposed to reduce inefficient operation and wet-stacking risk. Linear diesel fuel curves and minimum loading constraints are commonly used in HOMER-type microgrid studies
| [3] | T. O. Araoye, E. C. Ashigwuike, M. J. Mbunwe, O. I. Bakinson, and T. I. Ozue, "Techno-economic modeling and optimal sizing of autonomous hybrid microgrid renewable energy system for rural electrification sustainability using HOMER and grasshopper optimization algorithm," Renewable Energy, 2024, 229, 120712–120712. https://doi.org/10.1016/j.renene.2024.120712 |
| [11] | M. Bilal, P. N. Bokoro, and G. Sharma, "Hybrid optimization for sustainable design and sizing of standalone microgrids integrating renewable energy, diesel generators, and battery storage with environmental considerations," Results in Engineering, 2025, 25, 103764–103764.
https://doi.org/10.1016/j.rineng.2024.103764 |
[3, 11]
.
4.4.5 Biomass Gasifier Model
The biomass gasifier-generator is modelled as a dispatchable renewable generator. Biomass fuel demand is calculated as:
(16)
where:
= biomass consumed;
= electrical energy generated;
;
, defined on an as-received basis at approximately 15% moisture.
Biomass and biogas resources have been considered in rural hybrid energy systems because they provide dispatchable renewable generation where agricultural residues are available
| [7] | J. J. Bouendeu, F. A. Talla Konchou, M. N. B. Astrid, M. F. Elmorshedy, and T. René, "A systematic techno-enviro-socio-economic design optimization and power quality of hybrid renewable microgrids," Renewable Energy, 2023, 218, 119297–119297. https://doi.org/10.1016/j.renene.2023.119297 |
| [9] | S. Vendoti, M. Muralidhar, and R. Kiranmayi, "Techno-economic analysis of off-grid solar/wind/biogas/biomass/fuel cell/battery system for electrification in a cluster of villages by HOMER software," Environment, Development and Sustainability, 2021, 23(1), 351–372.
https://doi.org/10.1007/s10668-019-00583-2 |
[7, 9]
. The corresponding specific biomass consumption is:
Substituting and :
(18)
Only surplus agricultural residues are considered available. For sustainability, the annual biomass requirement must not exceed 35% of estimated available residues within the collection radius. This constraint reflects concerns that excessive residue removal can affect animal feed, soil fertility, and existing local uses
| [7] | J. J. Bouendeu, F. A. Talla Konchou, M. N. B. Astrid, M. F. Elmorshedy, and T. René, "A systematic techno-enviro-socio-economic design optimization and power quality of hybrid renewable microgrids," Renewable Energy, 2023, 218, 119297–119297. https://doi.org/10.1016/j.renene.2023.119297 |
| [9] | S. Vendoti, M. Muralidhar, and R. Kiranmayi, "Techno-economic analysis of off-grid solar/wind/biogas/biomass/fuel cell/battery system for electrification in a cluster of villages by HOMER software," Environment, Development and Sustainability, 2021, 23(1), 351–372.
https://doi.org/10.1007/s10668-019-00583-2 |
[7, 9]
.
4.4.6 Hydrogen Subsystem
The hydrogen architecture includes an electrolyze, hydrogen tank, and fuel cell. Hydrogen storage can improve long-duration renewable energy storage but often faces high capital cost and low round-trip efficiency at small rural scales
| [15] | M. F. Ali, M. R. I. Sheikh, R. Akter, K. M. N. Islam, and A. H. M. I. Ferdous, "Grid-connected hybrid microgrids with PV/wind/battery: Sustainable energy solutions for rural education in Bangladesh," Results in Engineering, 2025, 25, 103774–103774. https://doi.org/10.1016/j.rineng.2024.103774 |
| [18] | M. F. Ali, M. E. Azam, D. Biswas, N. Sarkar, and M. A. Razzak, "Techno-Economic Evaluation of a Hydrogen-Integrated Hybrid Renewable Microgrid for Rural Electrification," in 2025 International Conference on Modern Sustainable Systems (CMSS), 2025: IEEE, 860–865.
https://doi.org/10.1109/CMSS66566.2025.11182361 |
[15, 18]
.
Table 3 shows hydrogen subsystem assumptions.
Table 3. Hydrogen subsystem assumptions.
Component | Efficiency |
Electrolyser | 68% |
Hydrogen compression/storage | 95% |
Fuel cell | 50% |
The round-trip efficiency is:
0.68×0.95×0.50=0.323≈32%(19)
This low round-trip efficiency contributes to the weak economic performance of the hydrogen configuration at the studied load scale, consistent with hydrogen-integrated rural microgrid studies that report strong reliability but high cost
| [15] | M. F. Ali, M. R. I. Sheikh, R. Akter, K. M. N. Islam, and A. H. M. I. Ferdous, "Grid-connected hybrid microgrids with PV/wind/battery: Sustainable energy solutions for rural education in Bangladesh," Results in Engineering, 2025, 25, 103774–103774. https://doi.org/10.1016/j.rineng.2024.103774 |
| [18] | M. F. Ali, M. E. Azam, D. Biswas, N. Sarkar, and M. A. Razzak, "Techno-Economic Evaluation of a Hydrogen-Integrated Hybrid Renewable Microgrid for Rural Electrification," in 2025 International Conference on Modern Sustainable Systems (CMSS), 2025: IEEE, 860–865.
https://doi.org/10.1109/CMSS66566.2025.11182361 |
[15, 18]
.
4.5. Economic Model
The economic model follows standard discounted lifecycle-cost practice used in hybrid renewable microgrid studies
| [9] | S. Vendoti, M. Muralidhar, and R. Kiranmayi, "Techno-economic analysis of off-grid solar/wind/biogas/biomass/fuel cell/battery system for electrification in a cluster of villages by HOMER software," Environment, Development and Sustainability, 2021, 23(1), 351–372.
https://doi.org/10.1007/s10668-019-00583-2 |
[9]
. The capital recovery factor is:
(20)
For:
LCOE is computed as:
where:
= total net present cost;
= annual energy served to the load.
The discount rate and lifetime are selected to reflect typical long-term infrastructure evaluation assumptions used in rural microgrid studies
| [6] | H. Akter, H. O. R. Howlader, F. Mamud, A. Y. Saber, A. Yona, and T. Senjyu, "Optimal sizing and performance analysis of hybrid microgrid for remote island of developing country: Effect of sustainable parameters, benefits and installation barriers," Franklin Open, 2024, 6, 100074–100074.
https://doi.org/10.1016/j.fraope.2024.100074 |
| [11] | M. Bilal, P. N. Bokoro, and G. Sharma, "Hybrid optimization for sustainable design and sizing of standalone microgrids integrating renewable energy, diesel generators, and battery storage with environmental considerations," Results in Engineering, 2025, 25, 103764–103764.
https://doi.org/10.1016/j.rineng.2024.103764 |
[6, 11]
.
4.6. Payback Model
Payback is calculated as a simple project payback period under a community energy-service model. Simple payback is widely used in early-stage rural energy feasibility studies because it is easy for communities, developers, and local financiers to interpret, although it is less complete than net present value or internal rate of return
| [5] | N. Kumar, K. Namrata, and A. Samadhiya, "Techno socio-economic analysis and stratified assessment of hybrid renewable energy systems for electrification of rural community," Sustainable Energy Technologies and Assessments, 2023, 55, 102950–102950. https://doi.org/10.1016/j.seta.2022.102950 |
| [6] | H. Akter, H. O. R. Howlader, F. Mamud, A. Y. Saber, A. Yona, and T. Senjyu, "Optimal sizing and performance analysis of hybrid microgrid for remote island of developing country: Effect of sustainable parameters, benefits and installation barriers," Franklin Open, 2024, 6, 100074–100074.
https://doi.org/10.1016/j.fraope.2024.100074 |
[5, 6]
. It is not a discounted payback, and it is not an internal rate of return. No grant or capital subsidy is assumed in the base case.
The payback period is:
(24)
where:
= simple payback period in years;
= initial installed capital cost of the microgrid;
= annual electricity sales revenue;
= monetised avoided cost of incumbent household and enterprise energy expenditures;
= annual operation and maintenance cost;
= annual diesel or biomass feedstock cost;
= annual replacement reserve for batteries, converters, generators, fuel cells, and other replacement components.
The assumed average tariff is:
Therefore:
Productive use profit is not included in the payback calculation; only electricity sales revenue is included. This prevents overstatement of project returns. The avoided-cost term represents displaced expenditure on kerosene lighting, phone charging, small petrol generators, diesel pumping, and community security-lighting fuel. Such avoided-cost assumptions are relevant in rural communities where households and enterprises often rely on expensive informal or self-generation energy services
. Payback dispersion
is calculated by recomputing Eq. (
24) under the diesel-price, solar-resource, and demand shock scenarios.
Payback input assumptions and reproducibility: To make the payback values structured for reproducibility,
Table 4 reports the numerical inputs used in Eq. (
24). The payback calculation uses initial installed capital cost,
, rather than NPC. This distinction is important because NPC includes discounted replacement, fuel, O&M, and lifecycle costs over the project horizon, while
represents the initial project outlay borne at commissioning. Similar separation between upfront capital cost and lifecycle cost is common in techno-economic microgrid studies
| [9] | S. Vendoti, M. Muralidhar, and R. Kiranmayi, "Techno-economic analysis of off-grid solar/wind/biogas/biomass/fuel cell/battery system for electrification in a cluster of villages by HOMER software," Environment, Development and Sustainability, 2021, 23(1), 351–372.
https://doi.org/10.1007/s10668-019-00583-2 |
| [11] | M. Bilal, P. N. Bokoro, and G. Sharma, "Hybrid optimization for sustainable design and sizing of standalone microgrids integrating renewable energy, diesel generators, and battery storage with environmental considerations," Results in Engineering, 2025, 25, 103764–103764.
https://doi.org/10.1016/j.rineng.2024.103764 |
[9, 11]
.
The annual revenue is calculated from the assumed average tariff of US$0.30/kWh and the served annual load. The avoided-cost term represents displaced expenditure on kerosene lighting, petrol or diesel self-generation, commercial phone charging, small diesel pumping, and fuel-based community security lighting. Productive-use profit is not included, so the payback estimate remains conservative. Replacement reserve is treated as an annualized provision for future replacement of batteries, converters, diesel generators, biomass gasifier components, hydrogen tanks, electrolysis, and fuel cells, as applicable.
Table 4. Payback calculation inputs (where ICC = Initial capex US$k, ARR= Annual revenue US$k/yr, ACC = Avoided cost US$k/yr, OMC = O&M US$k/yr, FFC = Fuel/feedstock US$k/yr, RRC= Replacement reserve US$k/yr, NAB= Net annual benefit US$k/yr, A1= PV/Wind/Battery, A2 = PV/Diesel/Battery, A3 = PV/Wind/Hydrogen and A4 = PV/Biomass/Battery.
Architecture | ICC | ARR | ACC | OMC | FFC | RRC | NAB | Payback yr |
A1 | 343.00 | 44.09 | 18.00 | 7.60 | 0.00 | 15.10 | 39.39 | 8.70 |
A2 | 235.00 | 44.49 | 18.00 | 5.80 | 20.37 | 2.26 | 34.06 | 6.90 |
A3 | 443.00 | 44.58 | 15.00 | 9.00 | 0.00 | 14.86 | 35.72 | 12.40 |
A4 | 245.00 | 44.63 | 14.00 | 6.10 | 1.26 | 13.58 | 37.69 | 6.50 |
The net annual benefit is computed as:
(27)
and the simple payback is:
For example, for A4:
(29)
The fuel cost for A2 is based on 19,400 L/year of diesel at US$1.05/L, giving:
(30)
The feedstock cost for A4 is based on 28.0 t/year of as-received biomass at US$45/t, giving by Equation (
31):
(31)
Payback dispersion, , is then calculated by recomputing the payback period under the shock scenarios defined in Section 5.8.
4.7. Component Cost Assumptions
The component costs in
Table 5 are harmonized from recent rural hybrid microgrid literature and 2025 market-oriented assumptions. Similar cost categories are used in HOMER-type hybrid system studies, including capital cost, replacement cost, O&M cost, and component lifetime
| [3] | T. O. Araoye, E. C. Ashigwuike, M. J. Mbunwe, O. I. Bakinson, and T. I. Ozue, "Techno-economic modeling and optimal sizing of autonomous hybrid microgrid renewable energy system for rural electrification sustainability using HOMER and grasshopper optimization algorithm," Renewable Energy, 2024, 229, 120712–120712. https://doi.org/10.1016/j.renene.2024.120712 |
| [9] | S. Vendoti, M. Muralidhar, and R. Kiranmayi, "Techno-economic analysis of off-grid solar/wind/biogas/biomass/fuel cell/battery system for electrification in a cluster of villages by HOMER software," Environment, Development and Sustainability, 2021, 23(1), 351–372.
https://doi.org/10.1007/s10668-019-00583-2 |
| [11] | M. Bilal, P. N. Bokoro, and G. Sharma, "Hybrid optimization for sustainable design and sizing of standalone microgrids integrating renewable energy, diesel generators, and battery storage with environmental considerations," Results in Engineering, 2025, 25, 103764–103764.
https://doi.org/10.1016/j.rineng.2024.103764 |
[3, 9, 11]
.
Table 5. Component cost and lifetime assumptions.
Component | Unit | Capital cost | Replacement cost | O&M | Lifetime |
PV module | kW | US$720 | US$720 | US$12/kW-year | 25 yr |
Wind turbine | kW | US$2,200 | US$1,900 | US$45/kW-year | 20 yr |
LiFePO₄ battery | kWh | US$320 | US$300 | US$8/kWh-year | 12 yr |
Converter | kW | US$280 | US$260 | US$4/kW-year | 15 yr |
Diesel generator | kW | US$480 | US$460 | US$0.030/op-h | 20,000 h |
Electrolyser | kW | US$1,500 | US$1,300 | US$30/kW-year | 15 yr |
Hydrogen tank | kg | US$650 | US$600 | US$10/kg-year | 20 yr |
Fuel cell | kW | US$2,800 | US$2,500 | US$40/kW-year | 50,000 h |
Biomass gasifier-genset | kW | US$1,400 | US$1,200 | US$0.025/op-h | 25,000 h |
Cost assumptions remain a source of uncertainty in hybrid microgrid planning, especially for batteries, hydrogen systems, and small-scale biomass gasifiers. This is why sensitivity testing is important in addition to base-case optimization
| [12] | T. K. Roy, M. A. Mahmud, and A. M. T. Oo, "Techno-economic feasibility of stand-alone hybrid energy systems for a remote Australian community: Optimization and sensitivity analysis," Renewable Energy, 241, 122286–122286.
https://doi.org/10.1016/j.renene.2024.122286 |
| [13] | M. Salehi, M. Khanali, and H. Ghasemi-Mobtaker, "Techno-economic analysis of renewable hybrid system microgrids for minimizing grid power outages in residential areas," Cleaner Engineering and Technology, 2025, 25, 100924–100924.
https://doi.org/10.1016/j.clet.2025.100924 |
[12, 13]
.
4.8. Optimization Configuration and Reproducibility
This study uses a custom deterministic hourly simulation and enumerative optimization model. HOMER Pro was not used directly. The phrase “HOMER-class” therefore refers to the modelling logic: hourly energy-balance simulation, component dispatch, lifecycle cost calculation, and feasibility filtering. This modelling structure is consistent with HOMER-type approaches used in rural microgrid studies, but the explicit algorithm is provided to make the analysis reproducible without proprietary software
| [3] | T. O. Araoye, E. C. Ashigwuike, M. J. Mbunwe, O. I. Bakinson, and T. I. Ozue, "Techno-economic modeling and optimal sizing of autonomous hybrid microgrid renewable energy system for rural electrification sustainability using HOMER and grasshopper optimization algorithm," Renewable Energy, 2024, 229, 120712–120712. https://doi.org/10.1016/j.renene.2024.120712 |
| [9] | S. Vendoti, M. Muralidhar, and R. Kiranmayi, "Techno-economic analysis of off-grid solar/wind/biogas/biomass/fuel cell/battery system for electrification in a cluster of villages by HOMER software," Environment, Development and Sustainability, 2021, 23(1), 351–372.
https://doi.org/10.1007/s10668-019-00583-2 |
[3, 9]
.
Table 6 presents optimization search ranges and step sizes.
Four candidate architectures are simulated:
A1: PV/Wind/Battery;
A2: PV/Diesel/Battery;
A3: PV/Wind/Hydrogen;
A4: PV/Biomass/Battery.
The optimization minimizes NPC subject to:
Additional constraints include battery SOC limits, generator minimum-loading constraints, converter limits, hydrogen tank capacity limits, and biomass sustainability limits. Such constraints are consistent with reliability, renewable-fraction, and component-operation constraints used in hybrid renewable optimization studies
| [10] | W. Khalid, Q. Awais, M. Jamil, and A. A. Khan, "Dynamic Simulation and Optimization of Off-Grid Hybrid Power Systems for Sustainable Rural Development," Electronics, 2024, 13(13), 2487–2487.
https://doi.org/10.3390/electronics13132487 |
| [11] | M. Bilal, P. N. Bokoro, and G. Sharma, "Hybrid optimization for sustainable design and sizing of standalone microgrids integrating renewable energy, diesel generators, and battery storage with environmental considerations," Results in Engineering, 2025, 25, 103764–103764.
https://doi.org/10.1016/j.rineng.2024.103764 |
[10, 11]
. The optimization search ranges and step sizes of the components are shown in
Table 6.
Table 6. Optimization search ranges and step sizes.
Component | Search range | Step size |
PV | 50–200 kW | 5 kW |
Wind | 0–60 kW | 10 kW |
Battery | 100–500 kWh | 20 kWh |
Diesel generator | 0–60 kW | 5 kW |
Biomass generator | 0–60 kW | 5 kW |
Electrolyser | 0–60 kW | 5 kW |
Fuel cell | 0–60 kW | 5 kW |
Hydrogen tank | 0–100 kg | 5 kg |
Converter | 40–90 kW | 5 kW |
For each architecture, the model performs the following procedure.
Algorithm 1. Hourly simulation and optimization procedure
1) Generate candidate component-size combinations within the architecture-specific search space.
2) For each candidate, simulate 8,760 hourly intervals.
3) At each hour, calculate PV and wind generation.
4) Serve critical load first, then productive load, then domestic load.
5) Use surplus renewable generation to charge the battery or operate the electrolyze.
6) If renewable generation is insufficient, discharge storage subject to SOC or hydrogen limits.
7) If storage is insufficient, dispatch diesel or biomass backup subject to minimum-loading and rated-capacity constraints.
8) Record unmet load by tier.
9) Record fuel use, biomass use, storage throughput, curtailment, generator operating hours, and emissions.
10) Reject candidates violating LPSP, RF, SOC, generator-loading, or biomass-sustainability constraints.
11) Compute NPC, LCOE, payback, RSES sub-indices, and RSES score.
12) Select the minimum-NPC feasible design for each architecture.
13) Subject the selected design to shock scenarios and recompute LCOE, LPSP, payback, and RSES.
The use of 8,760 hourly intervals follows common practice in hybrid microgrid simulation because it captures daily and seasonal variation in renewable resources and load
| [6] | H. Akter, H. O. R. Howlader, F. Mamud, A. Y. Saber, A. Yona, and T. Senjyu, "Optimal sizing and performance analysis of hybrid microgrid for remote island of developing country: Effect of sustainable parameters, benefits and installation barriers," Franklin Open, 2024, 6, 100074–100074.
https://doi.org/10.1016/j.fraope.2024.100074 |
| [9] | S. Vendoti, M. Muralidhar, and R. Kiranmayi, "Techno-economic analysis of off-grid solar/wind/biogas/biomass/fuel cell/battery system for electrification in a cluster of villages by HOMER software," Environment, Development and Sustainability, 2021, 23(1), 351–372.
https://doi.org/10.1007/s10668-019-00583-2 |
[6, 9]
.
4.9. Data Availability and Reproducibility Package
To support reproducibility, the model is structured so that all simulations can be replicated from four input files and one dispatch script. The required input files are:
1) hourly profile for the critical, productive, and domestic tiers;
2) hourly solar irradiance and temperature profile;
3) hourly wind-speed profile;
4) component-cost and technical-parameter file.
The simulation script performs the hourly dispatch, applies the optimization search ranges in
Table 6, filters infeasible solutions using the constraints in Equations. (
27)-(
31), and calculates NPC, LCOE, LPSP, renewable fraction, payback, RSES sub-indices, and shock-response bands.
For transparency, the following reproducibility items should be provided as supplementary material or made available upon request:
1) hourly synthetic load profile, 8,760 rows;
2) hourly solar and wind resource profiles, 8,760 rows;
3) component technical and cost database;
4) optimization search-grid file;
5) dispatch and scoring script;
6) selected architecture output files;
7) shock-scenario output files.
5. Results and Discussion
5.1. Central-Case Architecture Ranking
Table 7 presents the central-case results. The NPC and LCOE values are internally consistent using Eq. (
23). The ranking confirms the importance of comparing cost, reliability, renewable fraction, and shock stability simultaneously rather than selecting only the minimum-NPC architecture
| [7] | J. J. Bouendeu, F. A. Talla Konchou, M. N. B. Astrid, M. F. Elmorshedy, and T. René, "A systematic techno-enviro-socio-economic design optimization and power quality of hybrid renewable microgrids," Renewable Energy, 2023, 218, 119297–119297. https://doi.org/10.1016/j.renene.2023.119297 |
| [12] | T. K. Roy, M. A. Mahmud, and A. M. T. Oo, "Techno-economic feasibility of stand-alone hybrid energy systems for a remote Australian community: Optimization and sensitivity analysis," Renewable Energy, 241, 122286–122286.
https://doi.org/10.1016/j.renene.2024.122286 |
[7, 12]
.
Table 7. Central-case architecture comparison.
Architecture | PV kW | Wind kW | Storage | Backup | NPC US$k | LCOE US$/kWh | Aggregate LPSP % | RF % | CO₂ avoided t/yr | Payback yr | RSES |
A1 | 135 | 30 | 360 kWh battery | — | 430 | 0.275 | 1.8 | 100 | 160 | 8.7 | 0.67 |
A2 | 110 | — | 260 kWh battery | 45 kW diesel | 360 | 0.227 | 0.9 | 71 | 108 | 6.9 | 0.64 |
A3 | 150 | 30 | 70 kg H₂ + fuel cell | — | 690 | 0.435 | 0.7 | 100 | 160 | 12.4 | 0.68 |
A4 | 120 | — | 240 kWh battery | 35 kW biomass | 335 | 0.211 | 0.6 | 94 | 154 | 6.5 | 0.80 |
The PV/Biomass/Battery architecture, A4, achieves the highest RSES score. Its advantage comes from low LCOE, low aggregate LPSP, high renewable fraction, dispatchable renewable backup, and low exposure to diesel-price volatility. This is consistent with the argument that biomass can improve the firmness of renewable microgrids where agricultural residues are locally available
| [7] | J. J. Bouendeu, F. A. Talla Konchou, M. N. B. Astrid, M. F. Elmorshedy, and T. René, "A systematic techno-enviro-socio-economic design optimization and power quality of hybrid renewable microgrids," Renewable Energy, 2023, 218, 119297–119297. https://doi.org/10.1016/j.renene.2023.119297 |
| [9] | S. Vendoti, M. Muralidhar, and R. Kiranmayi, "Techno-economic analysis of off-grid solar/wind/biogas/biomass/fuel cell/battery system for electrification in a cluster of villages by HOMER software," Environment, Development and Sustainability, 2021, 23(1), 351–372.
https://doi.org/10.1007/s10668-019-00583-2 |
[7, 9]
. The PV/Diesel/Battery system has a competitive base-case LCOE but performs worse on renewable fraction, emissions, and shock stability, reflecting concerns about diesel exposure in rural hybrid systems
| [3] | T. O. Araoye, E. C. Ashigwuike, M. J. Mbunwe, O. I. Bakinson, and T. I. Ozue, "Techno-economic modeling and optimal sizing of autonomous hybrid microgrid renewable energy system for rural electrification sustainability using HOMER and grasshopper optimization algorithm," Renewable Energy, 2024, 229, 120712–120712. https://doi.org/10.1016/j.renene.2024.120712 |
| [11] | M. Bilal, P. N. Bokoro, and G. Sharma, "Hybrid optimization for sustainable design and sizing of standalone microgrids integrating renewable energy, diesel generators, and battery storage with environmental considerations," Results in Engineering, 2025, 25, 103764–103764.
https://doi.org/10.1016/j.rineng.2024.103764 |
[3, 11]
. The PV/Wind/Hydrogen system achieves excellent reliability and renewable fraction but is penalized by high capital cost and low round-trip efficiency, consistent with hydrogen-integrated microgrid studies
| [18] | M. F. Ali, M. E. Azam, D. Biswas, N. Sarkar, and M. A. Razzak, "Techno-Economic Evaluation of a Hydrogen-Integrated Hybrid Renewable Microgrid for Rural Electrification," in 2025 International Conference on Modern Sustainable Systems (CMSS), 2025: IEEE, 860–865.
https://doi.org/10.1109/CMSS66566.2025.11182361 |
| [22] | M. F. Ali, M. R. Islam Sheikh, M. M. Julhash, and A. H. Sanvi, "Sustainable electrification of remote communities: Techno-economic and demand response analysis for renewable microgrids," Energy Conversion and Management: X, 2025, 26, 100963. https://doi.org/10.1016/j.ecmx.2025.100963 |
[18, 22]
.
5.2. Annual Energy Balance
Table 8 provides the annual energy balance for each architecture. Annual energy-balance reporting is important because headline values such as LCOE and renewable fraction can hide curtailment, storage losses, and backup-generator dependence
| [9] | S. Vendoti, M. Muralidhar, and R. Kiranmayi, "Techno-economic analysis of off-grid solar/wind/biogas/biomass/fuel cell/battery system for electrification in a cluster of villages by HOMER software," Environment, Development and Sustainability, 2021, 23(1), 351–372.
https://doi.org/10.1007/s10668-019-00583-2 |
[9]
.
Table 8. Annual energy balance.
Architecture | Gross PV output kWh/yr | Gross wind output kWh/yr | Direct renewable supply to load kWh/yr | Battery discharge to load kWh/yr | H₂ fuel-cell output to load kWh/yr | Diesel/biomass output to load kWh/yr | Curtailment kWh/yr | Storage/conversion losses kWh/yr | Unmet load kWh/yr | Served load kWh/yr |
A1 | 185,900 | 43,000 | 91,956 | 55,000 | — | — | 67,400 | 14,544 | 2,694 | 146,956 |
A2 | 142,000 | — | 69,303 | 36,000 | — | 43,000 diesel | 22,500 | 14,197 | 1,347 | 148,303 |
A3 | 206,500 | 42,000 | 130,103 | — | 18,500 | — | 54,000 | 45,897 | 1,047 | 148,603 |
A4 | 165,200 | — | 85,852 | 39,000 | — | 23,900 biomass | 24,800 | 15,548 | 898 | 148,752 |
The “direct renewable supply to load” column represents PV and wind energy consumed immediately by the load without passing through storage. The battery-discharge and H₂ fuel-cell columns represent stored energy delivered back to the load and are therefore not additional primary renewable generation. Storage/conversion losses include battery round-trip losses, converter losses, and, for A3, electrolyze–hydrogen–fuel-cell conversion losses. This format avoids double counting and shows how the served load is supplied:
(37)
For example, for A4:
148,752=85,852+39,000+23,900(38)
This confirms that the biomass generator contributes only 23,900 kWh/year and acts as a dispatchable renewable firming source rather than the dominant annual energy source.
The storage-discharge column reports delivered storage output, not additional primary generation. Curtailment includes unused renewable energy after serving load and satisfying available storage constraints. The difference between gross generation, curtailment, served load, and unmet load is attributable to battery, converter, hydrogen, and dispatch losses. Reporting these values improves transparency and follows good practice in hybrid microgrid assessment
| [6] | H. Akter, H. O. R. Howlader, F. Mamud, A. Y. Saber, A. Yona, and T. Senjyu, "Optimal sizing and performance analysis of hybrid microgrid for remote island of developing country: Effect of sustainable parameters, benefits and installation barriers," Franklin Open, 2024, 6, 100074–100074.
https://doi.org/10.1016/j.fraope.2024.100074 |
| [12] | T. K. Roy, M. A. Mahmud, and A. M. T. Oo, "Techno-economic feasibility of stand-alone hybrid energy systems for a remote Australian community: Optimization and sensitivity analysis," Renewable Energy, 241, 122286–122286.
https://doi.org/10.1016/j.renene.2024.122286 |
[6, 12]
.
5.3. Operating Statistics
Operating statistics are required to interpret the practical behavior of each architecture as shown in
Table 9. Backup operating hours, fuel or feedstock use, battery cycling, and capacity factors are especially important for maintenance planning and lifecycle cost estimation
| [11] | M. Bilal, P. N. Bokoro, and G. Sharma, "Hybrid optimization for sustainable design and sizing of standalone microgrids integrating renewable energy, diesel generators, and battery storage with environmental considerations," Results in Engineering, 2025, 25, 103764–103764.
https://doi.org/10.1016/j.rineng.2024.103764 |
[11]
.
Table 9. Operating statistics.
Architecture | Backup/storage operating hours | Fuel or feedstock use | Battery cycles/year | Backup capacity factor |
A1 | Battery discharge: 2,420 h | None | 191 equivalent full cycles | Not applicable |
A2 | Diesel: 2,390 h | 19,400 L diesel/year | 173 equivalent full cycles | 10.9% |
A3 | Fuel cell: 790 h; electrolyser: 1,610 h | 1,110 kg H₂/year cycled | 15.9 tank cycles/year | Fuel cell: 4.2% |
A4 | Biomass generator: 1,138 h | 28.0 t/year as-received biomass | 203 equivalent full cycles | 7.8% |
The operating statistics confirm that the A4 biomass generator does not serve the entire annual load. Instead, it operates as a firming source during evening peaks, cloudy periods, and high-demand intervals. This role is similar to the dispatchable-renewable function assigned to biomass and biogas in other hybrid rural energy studies
| [7] | J. J. Bouendeu, F. A. Talla Konchou, M. N. B. Astrid, M. F. Elmorshedy, and T. René, "A systematic techno-enviro-socio-economic design optimization and power quality of hybrid renewable microgrids," Renewable Energy, 2023, 218, 119297–119297. https://doi.org/10.1016/j.renene.2023.119297 |
| [9] | S. Vendoti, M. Muralidhar, and R. Kiranmayi, "Techno-economic analysis of off-grid solar/wind/biogas/biomass/fuel cell/battery system for electrification in a cluster of villages by HOMER software," Environment, Development and Sustainability, 2021, 23(1), 351–372.
https://doi.org/10.1007/s10668-019-00583-2 |
[7, 9]
.
5.4. Biomass Energy-Balance Reconciliation
The biomass calculation is reconciled explicitly because the preferred architecture depends on biomass availability. Biomass-energy consistency is essential in rural hybrid systems because an apparently attractive biomass design may fail if feedstock consumption, moisture, logistics, or sustainability constraints are underestimated
| [7] | J. J. Bouendeu, F. A. Talla Konchou, M. N. B. Astrid, M. F. Elmorshedy, and T. René, "A systematic techno-enviro-socio-economic design optimization and power quality of hybrid renewable microgrids," Renewable Energy, 2023, 218, 119297–119297. https://doi.org/10.1016/j.renene.2023.119297 |
| [9] | S. Vendoti, M. Muralidhar, and R. Kiranmayi, "Techno-economic analysis of off-grid solar/wind/biogas/biomass/fuel cell/battery system for electrification in a cluster of villages by HOMER software," Environment, Development and Sustainability, 2021, 23(1), 351–372.
https://doi.org/10.1007/s10668-019-00583-2 |
[7, 9]
.
For A4, the biomass generator supplies:
(39)
Using the specific biomass consumption from Eq. (
18):
The annual biomass consumption is therefore:
(41)
(42)
This value is defined on an as-received basis at approximately 15% moisture. The LHV of 14 MJ/kg is also defined on the same as-received basis. The dry-equivalent biomass requirement is approximately:
(43)
The assumed annual biomass availability is:
(44)
The fraction of available biomass used is:
This is far below the adopted 35% sustainable use threshold. Therefore, under the assumed agricultural-residue conditions, the biomass requirement is technically and logistically plausible. The average electrical loading of the biomass generator is:
(46)
For a 35 kW generator, the average loading during operation is:
The biomass capacity factor is computed using Equation (
41):
(48)
These values confirm that the biomass generator functions as a dispatchable renewable backup rather than as the dominant annual energy source. This correction is important because overestimating annual biomass consumption would distort both the feasibility analysis and the RSES ranking.
5.5. Tier-Specific Reliability Performance
Because the paper focuses on rural security, aggregating LPSP alone is insufficient. Critical services such as health posts, water pumping, and security lighting require stricter reliability protection than domestic discretionary loads
| [5] | N. Kumar, K. Namrata, and A. Samadhiya, "Techno socio-economic analysis and stratified assessment of hybrid renewable energy systems for electrification of rural community," Sustainable Energy Technologies and Assessments, 2023, 55, 102950–102950. https://doi.org/10.1016/j.seta.2022.102950 |
| [7] | J. J. Bouendeu, F. A. Talla Konchou, M. N. B. Astrid, M. F. Elmorshedy, and T. René, "A systematic techno-enviro-socio-economic design optimization and power quality of hybrid renewable microgrids," Renewable Energy, 2023, 218, 119297–119297. https://doi.org/10.1016/j.renene.2023.119297 |
[5, 7]
.
Table 10 reports reliability by load tier.
Table 10. Tier-specific LPSP results.
Architecture | Critical LPSP % | Productive LPSP % | Domestic LPSP % | Aggregate LPSP % |
A1 | 0.7 | 1.9 | 2.1 | 1.8 |
A2 | 0.4 | 0.8 | 1.2 | 0.9 |
A3 | 0.3 | 0.6 | 1.0 | 0.7 |
A4 | 0.2 | 0.5 | 0.8 | 0.6 |
All four designs satisfy the tier-specific reliability constraints. A4 performs best overall, while A3 also provides strong reliability but at a much higher cost. These results support the use of load-tier reliability constraints in rural microgrid design rather than relying only on aggregate unmet load
| [5] | N. Kumar, K. Namrata, and A. Samadhiya, "Techno socio-economic analysis and stratified assessment of hybrid renewable energy systems for electrification of rural community," Sustainable Energy Technologies and Assessments, 2023, 55, 102950–102950. https://doi.org/10.1016/j.seta.2022.102950 |
| [6] | H. Akter, H. O. R. Howlader, F. Mamud, A. Y. Saber, A. Yona, and T. Senjyu, "Optimal sizing and performance analysis of hybrid microgrid for remote island of developing country: Effect of sustainable parameters, benefits and installation barriers," Franklin Open, 2024, 6, 100074–100074.
https://doi.org/10.1016/j.fraope.2024.100074 |
[5, 6]
.
5.6. RSES Traceability and Sub-Index Calculation
Table 11 provides the intermediate variables required to reproduce the RSES values. Transparent index traceability is important because composite scores can obscure the drivers of ranking if intermediate variables are not reported
| [7] | J. J. Bouendeu, F. A. Talla Konchou, M. N. B. Astrid, M. F. Elmorshedy, and T. René, "A systematic techno-enviro-socio-economic design optimization and power quality of hybrid renewable microgrids," Renewable Energy, 2023, 218, 119297–119297. https://doi.org/10.1016/j.renene.2023.119297 |
| [12] | T. K. Roy, M. A. Mahmud, and A. M. T. Oo, "Techno-economic feasibility of stand-alone hybrid energy systems for a remote Australian community: Optimization and sensitivity analysis," Renewable Energy, 241, 122286–122286.
https://doi.org/10.1016/j.renene.2024.122286 |
[7, 12]
.
Table 11. RSES intermediate variables and sub-index values.
Architecture | LPSP % | Autonomy hours | LCOE US$/kWh | years | RF | CO₂ avoided t/yr | | | | RSES |
A1 | 1.8 | 18 | 0.275 | 1.05 | 1.00 | 160 | 0.67 | 0.51 | 1.00 | 0.67 |
A2 | 0.9 | 18 | 0.227 | 2.60 | 0.71 | 108 | 0.80 | 0.44 | 0.69 | 0.64 |
A3 | 0.7 | 24 | 0.435 | 0.80 | 1.00 | 160 | 0.90 | 0.30 | 1.00 | 0.68 |
A4 | 0.6 | 21 | 0.211 | 0.70 | 0.94 | 154 | 0.88 | 0.63 | 0.95 | 0.80 |
The sub-index values in
Table 11 were computed using Equations. (
4), (
5), and (
7), with all sub-indices clipped to the interval
| [1] | T. Zhang, X. Shi, D. Zhang, and J. Xiao, "Socio-economic development and electricity access in developing economies: A long-run model averaging approach," Energy Policy, 2019, 132, 223–231. https://doi.org/10.1016/j.enpol.2019.05.031 |
[1]
. The reported RSES score was then calculated using Equation (
1) with
,
, and
.
Table 11 shows why A4 dominates. A3 has the strongest security and environmental performance, but its economic-stability score is low because of high LCOE. A2 has good reliability but poor payback stability due to diesel-price exposure. A4 provides the strongest overall balance, which is consistent with the need to evaluate rural microgrids across cost, reliability, and resilience dimensions simultaneously
| [5] | N. Kumar, K. Namrata, and A. Samadhiya, "Techno socio-economic analysis and stratified assessment of hybrid renewable energy systems for electrification of rural community," Sustainable Energy Technologies and Assessments, 2023, 55, 102950–102950. https://doi.org/10.1016/j.seta.2022.102950 |
| [13] | M. Salehi, M. Khanali, and H. Ghasemi-Mobtaker, "Techno-economic analysis of renewable hybrid system microgrids for minimizing grid power outages in residential areas," Cleaner Engineering and Technology, 2025, 25, 100924–100924.
https://doi.org/10.1016/j.clet.2025.100924 |
[5, 13]
.
For the biomass-assisted architecture, the reported renewable fraction is treated as an effective renewable fraction rather than a purely operational renewable-energy share. The 94% value accounts for auxiliary biomass processing energy, feedstock logistics, and lifecycle adjustment relative to a diesel-only baseline. If biomass electricity is counted purely on an operational basis, A4’s renewable supply share approaches 100%
5.7. Pareto-Style Trade-Off Comparison
Figure 2 presents the Pareto-style trade-off plot of LCOE against aggregate LPSP. The x-axis represents LCOE, the y-axis represents aggregate LPSP, bubble size represents renewable fraction, and color intensity represents the RSES score. Pareto-style comparison is useful because it makes cost-reliability trade-offs visible rather than hiding them inside a single cost-minimization objective
| [7] | J. J. Bouendeu, F. A. Talla Konchou, M. N. B. Astrid, M. F. Elmorshedy, and T. René, "A systematic techno-enviro-socio-economic design optimization and power quality of hybrid renewable microgrids," Renewable Energy, 2023, 218, 119297–119297. https://doi.org/10.1016/j.renene.2023.119297 |
| [12] | T. K. Roy, M. A. Mahmud, and A. M. T. Oo, "Techno-economic feasibility of stand-alone hybrid energy systems for a remote Australian community: Optimization and sensitivity analysis," Renewable Energy, 241, 122286–122286.
https://doi.org/10.1016/j.renene.2024.122286 |
[7, 12]
.
Figure 2. Pareto-style trade-off plot of LCOE against aggregate LPSP.
The figures show that A4 occupies the most favorable region, with the lowest LCOE and lowest LPSP. A3 has strong reliability but lies far to the right because of high cost. A2 is cost-competitive but has lower renewable fraction and higher shock exposure. A1 has full renewable fraction but weaker reliability and higher cost than A4.
5.8. Shock-propagation Envelope
The shock analysis applies three perturbations:
where:
= base diesel price;
= base solar irradiance;
= base demand.
Shock testing is included because rural microgrid performance is sensitive to fuel prices, weather variability, and demand growth
| [12] | T. K. Roy, M. A. Mahmud, and A. M. T. Oo, "Techno-economic feasibility of stand-alone hybrid energy systems for a remote Australian community: Optimization and sensitivity analysis," Renewable Energy, 241, 122286–122286.
https://doi.org/10.1016/j.renene.2024.122286 |
| [13] | M. Salehi, M. Khanali, and H. Ghasemi-Mobtaker, "Techno-economic analysis of renewable hybrid system microgrids for minimizing grid power outages in residential areas," Cleaner Engineering and Technology, 2025, 25, 100924–100924.
https://doi.org/10.1016/j.clet.2025.100924 |
[12, 13]
. Shocks are applied one at a time and then in combined high-stress cases.
Table 12 reports the maximum observed deviation from the central case.
Table 12. Shock-propagation sensitivity envelope.
Architecture | ΔLCOE band US$/kWh | ΔLPSP band percentage points | ΔRSES band | Dominant shock driver |
A1 | −0.021 / +0.033 | −0.4 / +0.9 | −0.06 / +0.03 | Solar-resource reduction |
A2 | −0.041 / +0.081 | −0.3 / +0.5 | −0.14 / +0.04 | Diesel-price increase |
A3 | −0.030 / +0.045 | −0.2 / +0.4 | −0.05 / +0.02 | Solar-resource reduction |
A4 | −0.019 / +0.026 | −0.3 / +0.7 | −0.05 / +0.03 | Demand growth |
The band is calculated by recomputing all three sub-indices under each shock scenario rather than adjusting only the LCOE term. Therefore, the reported RSES deviation reflects simultaneous changes in reliability, affordability, payback dispersion, renewable contribution, and avoided emissions. This is important because a shock can affect more than one performance dimension. For example, reduced solar resource can increase LPSP, increase dispatchable backup use, reduce renewable fraction, and worsen payback.
The diesel-assisted system, A2, is the most sensitive to diesel-price escalation. A 30% fuel-price increase raises its LCOE substantially and reduces its RSES score. This finding is consistent with studies showing that diesel-assisted microgrids can appear economically attractive in the base case but become vulnerable under fuel-price volatility
| [3] | T. O. Araoye, E. C. Ashigwuike, M. J. Mbunwe, O. I. Bakinson, and T. I. Ozue, "Techno-economic modeling and optimal sizing of autonomous hybrid microgrid renewable energy system for rural electrification sustainability using HOMER and grasshopper optimization algorithm," Renewable Energy, 2024, 229, 120712–120712. https://doi.org/10.1016/j.renene.2024.120712 |
| [11] | M. Bilal, P. N. Bokoro, and G. Sharma, "Hybrid optimization for sustainable design and sizing of standalone microgrids integrating renewable energy, diesel generators, and battery storage with environmental considerations," Results in Engineering, 2025, 25, 103764–103764.
https://doi.org/10.1016/j.rineng.2024.103764 |
[3, 11]
. A4 shows the narrowest LCOE band. Its main vulnerability is demanding growth rather than fuel price, suggesting that biomass-assisted systems should be paired with modular expansion planning.
The shock analysis uses a nine-scenario set as shown in
Table 13. The base case is first simulated, followed by one-at-a-time perturbations for diesel price, solar resource, and demand. Two combined cases are then included to represent simultaneous low-stress and high-stress conditions. The same scenario set is used to compute LCOE deviation, LPSP deviation, RSES deviation, and payback dispersion
. Therefore, for Equation (
6), N=9.
Table 13. Shock scenarios used for sensitivity and payback-dispersion analysis.
Scenario | Diesel price | Solar resource | Demand | Purpose |
S0 | | | | Base case |
S1 | | | | Low diesel-price case |
S2 | | | | High diesel-price case |
S3 | | | | Low-solar-resource case |
S4 | | | | High-solar-resource case |
S5 | | | | Low-demand case |
S6 | | | | High-demand-growth case |
S7 | | | | Combined low-stress case |
S8 | | | | Combined high-stress case |
The reported shock bands in
Table 12 represent the maximum positive and negative deviations observed across these nine scenarios. Payback dispersion is computed as the standard deviation of the nine payback values obtained from S0–S8.
5.9. Weight-Sensitivity Analysis
Table 14. Weight-sensitivity results.
Scenario | | | | Highest-ranked architecture |
Base case | 0.40 | 0.40 | 0.20 | A4 |
Security-heavy | 0.55 | 0.30 | 0.15 | A4 |
Economy-heavy | 0.30 | 0.55 | 0.15 | A4 |
Environment-heavy | 0.25 | 0.25 | 0.50 | A4/A3 close |
Diesel-risk-averse | 0.45 | 0.45 | 0.10 | A4 |
Because RSES weights may vary across communities, a weight-sensitivity test is performed. Weight sensitivity is important in multi-criteria planning because communities may prioritize reliability, affordability, or emissions differently depending on local development objectives and institutional needs
| [5] | N. Kumar, K. Namrata, and A. Samadhiya, "Techno socio-economic analysis and stratified assessment of hybrid renewable energy systems for electrification of rural community," Sustainable Energy Technologies and Assessments, 2023, 55, 102950–102950. https://doi.org/10.1016/j.seta.2022.102950 |
| [7] | J. J. Bouendeu, F. A. Talla Konchou, M. N. B. Astrid, M. F. Elmorshedy, and T. René, "A systematic techno-enviro-socio-economic design optimization and power quality of hybrid renewable microgrids," Renewable Energy, 2023, 218, 119297–119297. https://doi.org/10.1016/j.renene.2023.119297 |
[5, 7]
.
Table 14 shows weight-sensitivity results for the five scenarios.
A4 remains the preferred architecture in most weighting cases. Under environment-heavy weighting, A3 becomes more competitive because of its full renewable fraction and avoided operational diesel emissions. However, its high cost prevents it from clearly dominating A4. This result supports the conclusion that architecture selection should be robust not only to technical shocks but also to reasonable variation in planner preferences
| [7] | J. J. Bouendeu, F. A. Talla Konchou, M. N. B. Astrid, M. F. Elmorshedy, and T. René, "A systematic techno-enviro-socio-economic design optimization and power quality of hybrid renewable microgrids," Renewable Energy, 2023, 218, 119297–119297. https://doi.org/10.1016/j.renene.2023.119297 |
| [12] | T. K. Roy, M. A. Mahmud, and A. M. T. Oo, "Techno-economic feasibility of stand-alone hybrid energy systems for a remote Australian community: Optimization and sensitivity analysis," Renewable Energy, 241, 122286–122286.
https://doi.org/10.1016/j.renene.2024.122286 |
[7, 12]
.
5.10. Discussion of Research Questions
RQ1: Joint Formalization of Reliability, Affordability, and Socio-Environmental Performance
The RSES framework demonstrates that reliability, affordability, and environmental performance can be combined into a single decision index without discarding their individual meanings. The sub-index structure allows planners to see both the final score and the underlying trade-offs. This approach is aligned with multi-criteria energy planning literature, which emphasizes that rural energy decisions should not be based on cost alone
| [5] | N. Kumar, K. Namrata, and A. Samadhiya, "Techno socio-economic analysis and stratified assessment of hybrid renewable energy systems for electrification of rural community," Sustainable Energy Technologies and Assessments, 2023, 55, 102950–102950. https://doi.org/10.1016/j.seta.2022.102950 |
| [7] | J. J. Bouendeu, F. A. Talla Konchou, M. N. B. Astrid, M. F. Elmorshedy, and T. René, "A systematic techno-enviro-socio-economic design optimization and power quality of hybrid renewable microgrids," Renewable Energy, 2023, 218, 119297–119297. https://doi.org/10.1016/j.renene.2023.119297 |
[5, 7]
. The inclusion of autonomy hours and payback dispersion extend conventional LCOE/LPSP-based microgrid planning.
RQ2: Dominant Architecture
For the representative Northern Nigerian rural cluster, the PV/Biomass/Battery architecture provides the strongest balance of cost, reliability, renewable fraction, and shock stability. This result is conditional on local biomass availability, feedstock logistics, and sustainable residue management. The result is consistent with studies showing that biomass can improve dispatchability in agricultural rural energy systems, but it should not be interpreted as a universal conclusion for all Nigerian communities
| [3] | T. O. Araoye, E. C. Ashigwuike, M. J. Mbunwe, O. I. Bakinson, and T. I. Ozue, "Techno-economic modeling and optimal sizing of autonomous hybrid microgrid renewable energy system for rural electrification sustainability using HOMER and grasshopper optimization algorithm," Renewable Energy, 2024, 229, 120712–120712. https://doi.org/10.1016/j.renene.2024.120712 |
| [7] | J. J. Bouendeu, F. A. Talla Konchou, M. N. B. Astrid, M. F. Elmorshedy, and T. René, "A systematic techno-enviro-socio-economic design optimization and power quality of hybrid renewable microgrids," Renewable Energy, 2023, 218, 119297–119297. https://doi.org/10.1016/j.renene.2023.119297 |
| [9] | S. Vendoti, M. Muralidhar, and R. Kiranmayi, "Techno-economic analysis of off-grid solar/wind/biogas/biomass/fuel cell/battery system for electrification in a cluster of villages by HOMER software," Environment, Development and Sustainability, 2021, 23(1), 351–372.
https://doi.org/10.1007/s10668-019-00583-2 |
[3, 7, 9]
.
RQ3: Shock Sensitivity
The results confirm that diesel-dependent systems are highly sensitive to fuel-price shocks. Solar-heavy systems are sensitive to irradiance reduction and demand growth. Biomass-assisted systems are comparatively stable but require strong feedstock planning and modular expansion strategies. This finding is consistent with sensitivity-analysis studies showing that point-estimate optimization can misrepresent long-term system risk
| [12] | T. K. Roy, M. A. Mahmud, and A. M. T. Oo, "Techno-economic feasibility of stand-alone hybrid energy systems for a remote Australian community: Optimization and sensitivity analysis," Renewable Energy, 241, 122286–122286.
https://doi.org/10.1016/j.renene.2024.122286 |
| [13] | M. Salehi, M. Khanali, and H. Ghasemi-Mobtaker, "Techno-economic analysis of renewable hybrid system microgrids for minimizing grid power outages in residential areas," Cleaner Engineering and Technology, 2025, 25, 100924–100924.
https://doi.org/10.1016/j.clet.2025.100924 |
[12, 13]
.